Specialities
 Services
 Resource Center
 Pricing
 About
About
 Contact
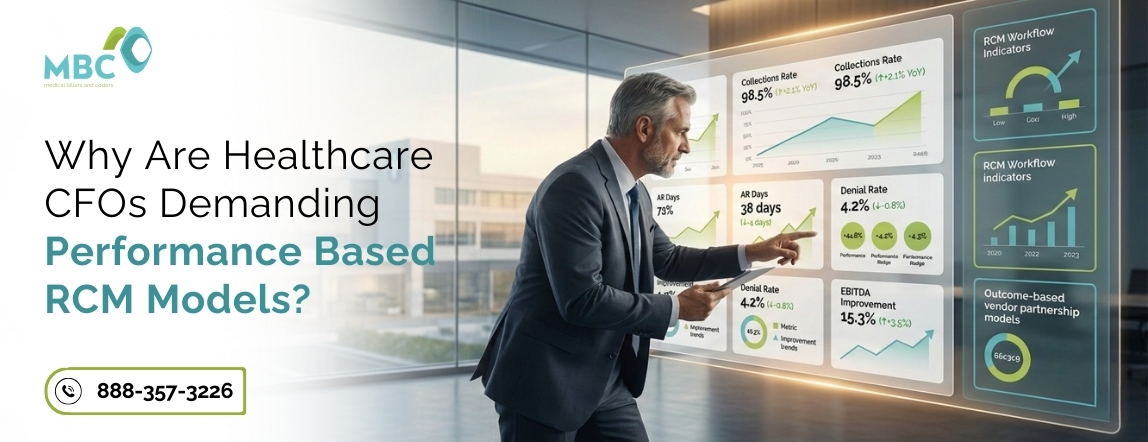
Performance Based RCM eliminates the misaligned incentives of percentage-pricing by tying vendor compensation directly to Net Collection Ratio improvement, Days in AR reduction, and quantified revenue recovery—delivering $340K-$680K in incremental margin protection that traditional RCM services cannot achieve through transactional claim processing.
The $520K Problem with Traditional Revenue Cycle Management Pricing
Your facility pays 6% of collections to your RCM vendor. They submitted 12,000 claims last quarter. Your Net Collection Ratio sits at 88%.
The vendor earned $180K. Your margin eroded by $340K due to payer variance, implant leakage, and compliance gaps they never identified.
Traditional revenue cycle management pricing creates a fundamental conflict: vendors maximize their revenue by processing volume, not by optimizing your collections quality. Outcome-based compensation models realign these incentives entirely.
According to the MGMA 2024 Financial Operations Report, practices using outcome-based RCM contracts report 8-14% higher Net Collection Ratios compared to percentage-based arrangements—translating to $420K-$780K annual impact for multi-specialty groups with $6M+ collections.
The transformation happens when your RCM services partner’s compensation depends on the same metrics driving your board-level strategic priorities: margin protection, compliance risk reduction, and accelerated cash flow.
How Performance-Aligned Revenue Cycle Operations Actually Work?
Generic medical billing services charge percentage-of-collections (4-8%) regardless of performance quality. Performance Based RCM structures compensation around facility-specific KPIs with measurable financial impact.
The Three-Tier Performance Architecture:
Tier 1: Baseline Operations (30% of Compensation) Core revenue cycle activities receive fixed compensation for maintaining operational infrastructure:
- Claim submission within 24 hours of service
- Payment posting accuracy above 99.2%
- Patient statement generation within 7-day cycle
- Standard denial management workflows
This baseline ensures consistent operations while eliminating the volume-processing incentive that destroys collection quality.
Tier 2: Performance Benchmarks (50% of Compensation) Variable compensation tied to facility-specific metrics vs. baseline performance:
- Net Collection Ratio improvement: $15K per percentage point increase
- Days in AR reduction: $8K per day of improvement
- Denial rate compression: $12K per percentage point decrease
- First-pass resolution rate: $6K per percentage point above 92%
One 8-physician orthopedic group using this model saw their RCM partner increase NCR from 89% to 97% within 90 days because the vendor earned $120K in performance bonuses by delivering $418K in incremental collections.
Tier 3: Strategic Value Creation (20% of Compensation) Bonus compensation for identifying and recovering systematic leakage:
- Payer contract variance recovery (25% of identified underpayments)
- Implant cost recovery implementation ($50K bonus for infrastructure deployment)
- Compliance audit prevention (risk score improvement bonuses)
- Technology integration delivering measurable ROI
This tier transforms your revenue cycle vendor from transaction processor to strategic revenue operations partner.
The ONC Interoperability Final Rule 2024 mandates specific API access requirements that enable performance measurement transparency previously impossible—making outcome-based revenue cycle management economically viable for the first time.
The Pricing Model Comparison That Reveals Everything
| Pricing Component | Traditional RCM (% Collections) | Performance Based RCM | Alignment Impact |
| Compensation Driver | Gross collections volume | Net Collection Ratio quality | Vendor optimizes for client outcome |
| Technology Investment | Avoided (reduces margin) | Incentivized (improves performance metrics) | Advanced infrastructure deployment |
| Payer Variance Detection | No incentive (already paid) | Direct bonus compensation | $140K-$320K recovery |
| Compliance Risk | Client absorbs 100% | Shared accountability with penalties | Proactive OIG protection |
| Denial Prevention | Reactive only | Proactive (tied to denial rate KPI) | 8.2% to 1.8% denial reduction |
| Transparency | Monthly summaries | Real-time dashboard with KPI tracking | CFO-grade visibility |
The table demonstrates why percentage pricing persists despite inferior outcomes: it’s simpler for vendors to implement, even though it destroys client value.
What Performance-Aligned Pricing Actually Looks Like?
Real-world Performance Based RCM contracts structure compensation around measurable outcomes with downside protection for operational stability:
Sample Structure for $6M Multi-Specialty Group:
Base Operations Fee: $18K/month
- Covers core claim processing, payment posting, patient statements
- Ensures operational continuity regardless of performance variance
Performance Incentives (Monthly Variable):
- NCR Target 95%: $0 at 92% or below | $8K at 95% | $15K at 97%+
- Days in AR Target 25: $0 at 35+ | $6K at 25 | $12K at 18 or below
- Denial Rate Target 3%: $0 at 6%+ | $5K at 3% | $10K at 1.5% or below
Strategic Value Bonuses (Quarterly):
- Payer variance recovery: 25% of identified underpayments
- Implant leakage elimination: $40K implementation + 15% of recovered revenue
- Compliance infrastructure: $25K for achieving 95+ risk score
Annual Total Compensation Range: $216K-$420K
- Traditional 6% pricing would cost: $360K regardless of performance
- Outcome-based models deliver better alignment with 40% cost variance based on actual results
According to CMS Value-Based Programs, the shift toward outcome-based compensation in healthcare creates systematic pressure for revenue cycle management to adopt similar models—driving the industry transformation toward performance accountability.
The Compliance Alignment That Traditional RCM Cannot Deliver
The OIG Work Plan 2025 identifies specific audit targets creating financial risk for practices:
- Modifier usage accuracy in surgical billing
- Implant cost documentation in orthopedics/ophthalmology
- E/M level support in primary care
- Global period service bundling
Traditional percentage-based RCM vendors absorb zero liability when compliance failures trigger audits. They’ve already been paid.
Performance Based RCM includes compliance risk-sharing provisions:
- Penalty clauses for systematic coding errors identified in audits
- Shared liability for OIG recoupment due to vendor coding failures
- Proactive compliance scoring with compensation tied to risk reduction
One ASC avoided $142K in Medicare recoupment when their outcome-aligned partner identified modifier errors before OIG audit notification—something their previous percentage-vendor had been making for 22 months without detection.
Technology Infrastructure as Performance Enabler
Performance-driven revenue cycle operations require technical capabilities that traditional medical billing services avoid due to capital investment requirements:
Required Infrastructure Components:
- Bidirectional EHR integration for real-time charge capture
- Payer contract analytics detecting systematic underpayments
- AI-powered denial prediction preventing rejections before submission
- Executive dashboards with facility-specific KPI tracking
- Automated LCD compliance verification against clinical documentation
These technologies cost $80K-$150K to deploy. Percentage-based vendors won’t invest because ROI accrues to the client, not the vendor.
Performance-aligned compensation makes technology investment economically rational—the vendor recovers costs through performance bonuses while delivering $280K-$520K in client revenue improvement.
The CMS Prior Authorization Final Rule 2024 mandates specific API integration and automation requirements that outcome-based infrastructure delivers as core operational capability.
When Revenue Cycle Becomes Strategic Asset Rather Than Cost Center?
Multi-specialty groups, ASCs, and health systems require RCM services that function as embedded revenue operations infrastructure—not transactional claim processors.
Performance Based RCM transforms vendor relationships through:
Strategic Revenue Briefings: Quarterly executive sessions connecting operational KPIs to board-level priorities including:
- Site-of-service migration impact modeling
- Payer contract negotiation leverage from claims data
- Portfolio acquisition revenue due diligence
- Capital equipment ROI verification through utilization analysis
Dedicated RCM Principal: Senior advisor conducting systematic portfolio risk reviews and financial yield assessments rather than account manager handling support tickets.
Center of Excellence Access: Specialty-specific teams architecting margin protection for high-complexity areas where generic vendors fail:
- Orthopedic implant revenue recovery
- Cardiology modifier optimization
- Ophthalmology ASC vs office-based strategy
- Gastroenterology pathology correlation protocols
One PE-backed multi-specialty platform switched from 5% percentage-pricing to outcome-aligned revenue cycle operations across 6 locations. Result within 120 days:
- Portfolio NCR increased from 88% to 95%
- Combined revenue improvement: $1.2M annually
- RCM services costs decreased 18% despite superior performance
- Enterprise value increased through margin enhancement
Transform RCM from Expense to Competitive Advantage
If your current revenue cycle vendor earns the same compensation whether your NCR is 85% or 97%, your pricing model creates the wrong incentives.
Medical Billers and Coders (MBC) pioneered Performance Based RCM contracts tying our compensation to the metrics driving your board-level strategic priorities: margin protection, compliance risk reduction, and accelerated cash flow.
Discover what properly aligned RCM services deliver: Request Your Performance-Based Proposal
We don’t get paid for processing claims. We get paid for protecting your margin.
Performance Based RCM FAQs
Traditional RCM charges fixed percentage (4-8%) of gross collections regardless of quality; outcome-based models tie 50-70% of compensation to Net Collection Ratio improvement, Days in AR reduction, and denial rate metrics. This alignment delivers $340K-$680K better outcomes for multi-specialty groups versus transactional percentage models.
Core KPIs include Net Collection Ratio (target 94-98%), Days in AR (target 18-28 days), denial rate (target 1.5-3%), and first-pass resolution rate (target 92%+). Advanced contracts add payer variance recovery, compliance risk scoring, and specialty-specific metrics like implant capture rates for surgical practices.
Initial base fees may appear higher, but total compensation varies with performance—delivering 15-30% lower costs when performance targets are met while generating $420K-$780K in incremental revenue. The cost structure creates shared risk/reward alignment versus percentage-pricing that extracts fees regardless of collection quality.
Properly implemented performance contracts deliver measurable impact within 30-60 days including NCR improvement and AR reduction, with full systematic optimization (payer variance recovery, compliance infrastructure, technology integration) completing within 90-120 days. Quick wins fund longer-term strategic value creation.
Outcome-based contracts include downside protection through base operational fees covering core processing, with variable compensation reduced when KPIs miss targets. This creates mutual accountability—vendors invest in infrastructure and expertise to earn performance bonuses while clients avoid paying premium rates for substandard results.
References and Sources:
- MGMA DataDive Financials and Operations Data
- CMS Prior Authorization Final Rule 2024
- What are the value-based programs?

With almost 12 years of experience in healthcare revenue cycle management, this Revenue Cycle Specialist brings deep expertise in medical billing, claims optimization, and practice profitability. Shares industry-backed insights focused on improving collections, reducing denials, and driving operational excellence.