Specialities
 Services
 Resource Center
 Pricing
 About
About
 Contact
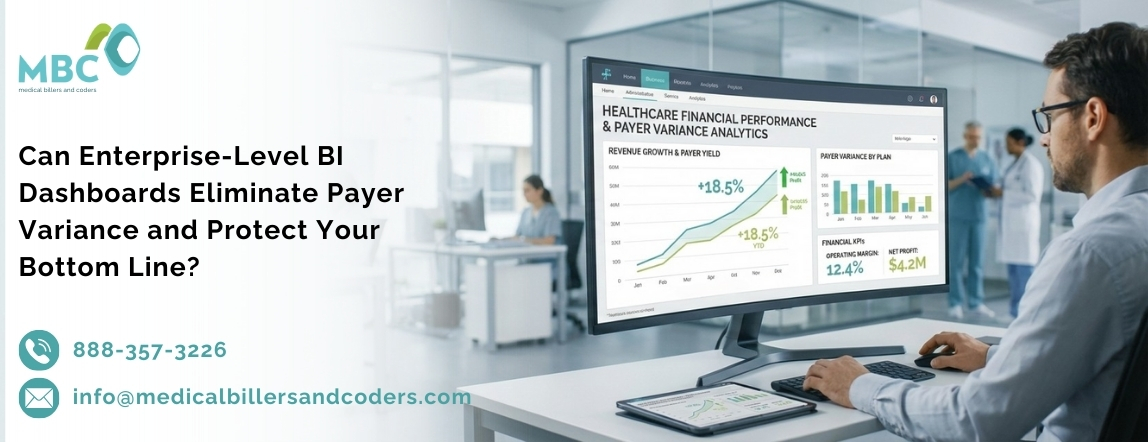
Yes—Enterprise-Level BI Dashboards Provide Real-Time Intelligence That Identifies and Eliminates Payer Variance Before It Impacts Revenue
Enterprise-Level BI Dashboards eliminate payer variance by providing institutional oversight of your entire RCM ecosystem. You cannot manage what you cannot see. Without real-time visibility into payer performance, denial patterns, and revenue leakage, health systems operate blindly, discovering revenue issues months after they occur. MBC’s Enterprise-Level BI Dashboards give you a “God’s-eye view” of your entire Revenue Cycle Management infrastructure, from payer variance to staff productivity to claims analytics—enabling proactive intervention before revenue loss compounds.
The modern enterprise healthcare organization operates across multiple locations, specialties, and payer contracts simultaneously. Traditional reporting systems provide monthly snapshots (usually 30-45 days delayed). Enterprise-Level BI Dashboards provide real-time institutional visibility, enabling CFOs and RCM leaders to identify revenue variances within hours rather than days and implement corrective actions before revenue is lost.
Real-Time Intelligence for Institutional Oversight
Healthcare organizations cannot manage payer variance without real-time visibility into it. Payer variance—the systematic difference between what payers pay vs. contracted rates—typically accounts for 3-8% of gross revenue. For a $500M health system, a 5% payer variance results in $25M in annual revenue loss.
Yet most health systems discover payer variance through manual chart audits months after claims are paid. By then, the opportunity for proactive correction has passed.
Enterprise-Level BI Dashboards provide:
Real-Time Payer Performance Analytics
- Which payers are underpaying contracts most aggressively
- Underpayment patterns by procedure code, place of service, and specialty
- Trend analysis: Is underpayment increasing or decreasing by payer?
- Contract compliance verification: Are actual payments matching negotiated rates?
Example: One health system’s dashboard identified that a major commercial payer was systematically underpaying orthopedic facility fees by $180- $ 420 per case. Real-time visibility enabled contract renegotiation within 30 days, resulting in $2.8M in annual savings.
Portfolio-Level Visibility Across Enterprise
- Track performance metrics across all locations, specialties, and payer contracts from a single executive dashboard
- Drill down from enterprise metrics to individual provider-level performance in seconds
- Compare location performance, specialty performance, and payer performance simultaneously
- Identify which locations/specialties/providers are leaving money on the table
Denial Trend Escalation Alerts
- Real-time denial rate monitoring by payer, procedure, and denial reason
- Automated alerts when denial rates exceed thresholds (e.g., “Denial rate for CPT 99285 with Payer X increased to 18%”)
- Root cause identification: Is this a documentation gap, coding error, or payer policy change?
- Proactive intervention enables correction before denial patterns compound
The MBC Interoperability Engine: Seamlessly Bridging Clinical and Financial Systems
Enterprise BI dashboards are only valuable if they integrate seamlessly with clinical and financial systems. Fragmented data creates information gaps; integrated data enables enterprise intelligence.
The MBC Interoperability Engine bridges clinical and financial systems without requiring technology replacement or organizational disruption.
Epic/Cerner Integration: Direct Clinical Data Flow
Most enterprise health systems operate Epic or Cerner as their primary EHR. MBC’s interoperability engine connects directly to Epic/Cerner databases, enabling:
- Real-time clinical documentation flows from the point of care to coding and billing systems
- Automated charge capture from clinical encounter data (procedures, diagnoses, supplies)
- Documentation completeness verification before claim submission (missing fields, gaps identified)
- Status conversion intelligence (procedures coded as outpatient that meet inpatient criteria)
Direct EHR integration eliminates manual data-entry errors and enables real-time claim intelligence tied to clinical documentation.
Payer Portal Integration: Direct Payment Intelligence
Rather than waiting for remittance advice (often 10-15 days delayed), MBC integrates directly with payer portals, enabling:
- Real-time payment data is immediately available upon payer processing
- Payment variance identification the moment underpayment occurs
- Automated payment posting from payer to accounting system
- Explanation of benefit (EOB) analysis is automated and flagged for review
Payment portal integration reduces payment lag from 10-15 days to real-time visibility.
Claims Analytics Engine: Complete Claim Visibility
The MBC Claims Analytics engine tracks claims through the entire lifecycle:
- Pre-submission analytics: Identifies high-risk claims before submission (NCCI violations, documentation gaps, compliance issues)
- Submission tracking: Real-time visibility into which claims are submitted, when, and to which payer
- Denial analytics: Detailed denial reason tracking, trend analysis, appeal prioritization
- Payment analytics: Allowable vs. paid comparison, underpayment identification, contract compliance verification
Complete claim visibility enables identification of revenue leakage at every stage.
Real-Time Alerts: Proactive Risk Mitigation
Rather than discovering problems through retrospective analysis, MBC dashboards provide real-time alerts:
- Payer Policy Change Alerts: When payers update coverage rules, prior authorization requirements, or bundling policies
- Denial Trend Escalation Alerts: When denial rates for specific codes/procedures exceed thresholds
- Payment Variance Alerts: When actual payments fall below contracted amounts
- Documentation Quality Alerts: When claims lack documentation supporting the billed service level
- Compliance Risk Alerts: When billing patterns appear anomalous or high-risk
Real-time alerts enable immediate intervention, preventing systematic errors from compounding.
Portfolio-Level Visibility: Managing Enterprise-Scale Complexity
Large health systems operate across dozens of locations, multiple specialties, and hundreds of payer contracts. Managing this complexity requires portfolio-level visibility—the ability to track performance across the entire enterprise while instantly drilling down to the individual provider level.
Enterprise-Level BI Dashboards Enable:
Multi-Location Performance Comparison
- Which locations achieve the highest clean claim rates?
- Which locations have the longest days in A/R?
- Which locations have the highest denial rates?
- Identify best practices from high-performing locations and replicate across underperforming locations
Specialty-Level Performance Tracking
- Which specialties achieve the best net collection ratios?
- Which specialties have the highest denial rates?
- Which specialties have the longest claims aging?
- Compare specialty economics to identify revenue optimization opportunities
Provider-Level Accountability
- Track individual provider coding patterns, denial rates, and documentation quality
- Identify providers with documentation gaps or coding inconsistencies
- Enable peer comparison (provider X achieves 95% clean claims; provider Y achieves 82%)
- Drive accountability for RCM quality through transparent performance visibility
Payer Contract Performance
- Track actual payment performance vs. contracted rates for each major payer
- Identify underpayment patterns by payer
- Enable data-driven contract renegotiation with specific underpayment evidence
- Prioritize payers with the largest variance for contract renegotiation
Predictive Risk Modeling: AI-Powered Revenue Forecasting
Beyond real-time visibility, enterprise BI dashboards provide predictive intelligence that identifies revenue at risk before it becomes uncollectible.
AI-Powered Predictive Modeling Identifies:
Revenue at Risk Before Denial
- Machine learning analyzes historical claim patterns to predict which claims will be denied before submission
- Flags high-risk claims for additional review, documentation, or prior authorization
- Enables proactive intervention, preventing denials before they occur
- 78% denial overturn rate through predictive intelligence, enabling targeted appeals
Payer Policy Risk
- Monitors payer website updates, policy communications, and coverage changes
- Alerts when payers announce policy changes that will impact reimbursement
- Enables proactive contract renegotiation before policy change implementation
- Example: Payer announces bundling rule change effective 90 days out; dashboard alerts enable advance preparation and billing process adjustment before the change takes effect
Denial Trend Forecasting
- Identifies emerging denial trends before they become systemic problems
- Example: Denial rate for specific CPT code trending upward from 3% to 7%—alerts enable root cause investigation before reaching 10%+
- Enables pattern-based intervention (documentation improvements, coding adjustments, prior authorization protocol changes)
Cash Flow Forecasting
- Predicts future cash flow based on current claims pipeline, historical collection patterns, and payer payment patterns
- CFOs can forecast monthly/quarterly revenue with confidence
- Enables proactive working capital management and financial planning
Zero Technology Debt: Integration Without Disruption
Most enterprise BI solutions require significant changes to technology infrastructure: replacing EHRs, decommissioning existing systems, retraining staff, and managing implementation disruption. MBC’s approach is fundamentally different.
The MBC Advantage: Zero Technology Debt
Seamless Integration with Existing Infrastructure
- Connects directly to Epic, Cerner, Athena, and other major EHR platforms
- No rip-and-replace required
- No switching costs
- Works within your existing ecosystem
No EHR Replacement Required
- Your existing EHR (Epic/Cerner) remains the primary system of record
- MBC dashboards draw real-time data from your EHR
- Zero disruption to clinical workflows
- Clinical staff see no system changes
No Specialized IT Infrastructure
- MBC platform is cloud-based, accessible via standard web browsers
- No new servers, networks, or infrastructure investments required
- Scales automatically as your organization grows
- Updates and maintenance handled by MBC; your IT staff needs minimal involvement
Rapid Implementation
- Typical enterprise implementation: 30-60 days
- No extended implementation projects disrupting operations
- Phased rollout by department/location if preferred
- Training minimal (platform is intuitive)
Cost Advantage
- No technology debt means lower total cost of ownership
- No rip-and-replace costs
- No long implementation projects
- Predictable variable cost model (percentage of recovered revenue)
Real-World Enterprise Impact
A 300-location health system with $2 billion annual revenue implemented MBC Enterprise BI Dashboards. Results within 12 months:
Financial Impact:
- Identified $47M annual payer variance through portfolio-level visibility
- Renegotiated contracts with the top 8 underpaying payers, recovering $18.3M annually
- Reduced overall cost-to-collect from 11.2% to 6.8% through operational improvements identified via dashboard analytics
- Recovered $2.1M in aged claims through systematic A/R cleanup enabled by dashboard visibility
Operational Impact:
- Days in A/R reduced from 42 to 28 days
- Clean claim rate improved from 88% to 96.2%
- Denial rate reduced from 7.1% to 3.8%
- RCM staff productivity increased 35% through dashboard-guided workflow optimization
Strategic Impact:
- CFO gained predictive revenue visibility, enabling accurate budget forecasting
- Chief Medical Officer identified documentation gaps enabling targeted physician education
- The board received transparent RCM performance reporting, improving organizational accountability
- Competitive advantage: Predictive intelligence enabled faster response to payer policy changes vs. competitors
Conclusion: Real-Time Intelligence as Competitive Advantage
Enterprise health systems that implement Enterprise-Level BI Dashboards gain a competitive advantage: proactive revenue management instead of reactive firefighting. Payer variance that competitors discover months later, you discover in real-time. Denial trends that compound for competitors, you prevent before they escalate. Revenue opportunities competitors miss, you capitalize on through portfolio-level visibility.
Real-time intelligence isn’t optional for modern enterprises. It’s essential for financial survival. Enterprise-Level BI Dashboards transform data into a strategic advantage, enabling CFOs to make informed decisions based on real-time insights rather than historical reports.
Ready to Implement Enterprise BI Dashboards?
Enterprise health systems operating without real-time BI dashboards are leaving millions in revenue variance unchecked. Request a complimentary Portfolio Analysis from Medical Billers and Coders today and discover exactly how much revenue variance your health system is experiencing across all locations, specialties, and payers. Our portfolio analysis identifies specific payers underpaying contracts, locations with suboptimal claims performance, and specialties leaving money on the table—all with quantified dollar impact.
Medical Billers and Coders (MBC) have spent over 25 years specializing in Enterprise RCM for health systems and large medical groups. We provide Real-Time BI Dashboards, Zero Technology Debt integration with your existing Epic/Cerner environment, and dedicated Enterprise Specialists who understand the complexity of managing revenue across multiple locations, payers, and clinical specialties. Our Enterprise-Level BI Dashboards have helped hundreds of health systems recover $600K-$2M in Year One revenue while reducing total cost-to-collect by 40-60%.
Don’t let revenue variance remain hidden. Contact Medical Billers and Coders today and transform your enterprise revenue cycle from reactive firefighting into proactive optimization. Reach us at Phone: 888-357-3226 or Email: info@medicalbillersandcoders.com to schedule your complimentary portfolio analysis.
Frequently Asked Questions
BI dashboards don’t eliminate variance—they reveal it. Real-time visibility into payer payment patterns enables: (1) Identification of underpayment, (2) Documentation of contract violations, (3) Data-driven contract renegotiation with specific evidence. One health system discovered a major payer underpaying orthopedic facility fees by $400/case. Dashboard evidence enabled renegotiation, resulting in $2.8M in annual savings.
Most organizations identify revenue leakage within the first 30 days, begin recovery within 60 days, and achieve full ROI within 90 days. Average Year One financial impact: $600K-$2M in recovered/prevented revenue leakage, plus 40-60% reduction in RCM staff time through automation-driven efficiency.
Ask your vendor following questions:
Real-time or batch reporting?
Does it integrate directly with your EHR, or require manual data entry?
Does it provide predictive analytics or only retrospective reporting?
What’s your total cost, including implementation, training, and maintenance?
Most legacy systems are batch-based (with 30-45 day delays), require manual data entry, and lack predictive capabilities. MBC dashboards are real-time, fully integrated, and AI-powered.
No. MBC integrates directly with Epic/Cerner and operates as an add-on dashboard. Clinical staff see no changes to EHR workflows. Implementation is 30-60 days with minimal IT involvement. Zero disruption.
Five essential metrics:
(1) Cost-to-Collect (target 4-8% vs. industry 11-14%),
(2) Net Collection Ratio (target 95-98%),
(3) Days in A/R (target <30 days),
(4) Clean Claims Ratio (target >95%),
(5) Denial Rate (target <4%).
These five metrics reveal complete RCM health.

With almost 12 years of experience in healthcare revenue cycle management, this Revenue Cycle Specialist brings deep expertise in medical billing, claims optimization, and practice profitability. Shares industry-backed insights focused on improving collections, reducing denials, and driving operational excellence.