
EBITDA moves the board, not CPT code utilization—because healthcare practices collecting $1M–$5M+ monthly can achieve 95%+ CPT code utilization accuracy and high procedural volume while experiencing negative EBITDA growth when systematic revenue cycle failures create $1.2M–$3.8M annual leakage through payer variance detection gaps, denial root-cause engineering failures, and net collection ratio suppression.
For healthcare executives and practice owners, understanding why perfect Current Procedural Terminology (CPT) code utilization doesn’t guarantee financial performance is the foundation of building a revenue cycle infrastructure that actually moves EBITDA—the only financial performance metric boards, investors, and lenders care about.
The CPT Code Utilization Illusion: High Volume, Low EBITDA
Table 1: Why High Current Procedural Terminology (CPT) code utilization Volume Doesn’t guarantee EBITDA Growth
| Practice Metric | High-Volume Practice A | High-Value Practice B | EBITDA Impact |
| Monthly procedures | 800 procedures | 600 procedures | Volume doesn’t predict profit |
| CPT code utilization accuracy | 96% | 94% | Accuracy alone insufficient |
| Gross charges | $4.2M monthly | $3.8M monthly | Charges ≠ collections |
| Net collections | $3.1M (74% NCR) | $3.6M (95% NCR) | Collections drive EBITDA |
| Monthly EBITDA | $420,000 (13.5%) | $1,080,000 (30%) | Practice B: 2.5x higher EBITDA |
The Gap: Practice A performs more procedures with higher Current Procedural Terminology (CPT) code utilization accuracy, but generates lower EBITDA because:
- No payer variance detection (commercial denials 38%)
- Minimal denial root-cause engineering (12% appeal rate)
- Poor net collection ratio (74% vs. 95%)
Practice B achieves superior EBITDA through:
- Payer-specific billing protocols (denial rate 8%)
- Systematic denial root-cause engineering (78% appeal rate on viable denials)
- High net collection ratio (95%)
Three Revenue Cycle Gaps Between Current Procedural Terminology (CPT) code utilization and EBITDA
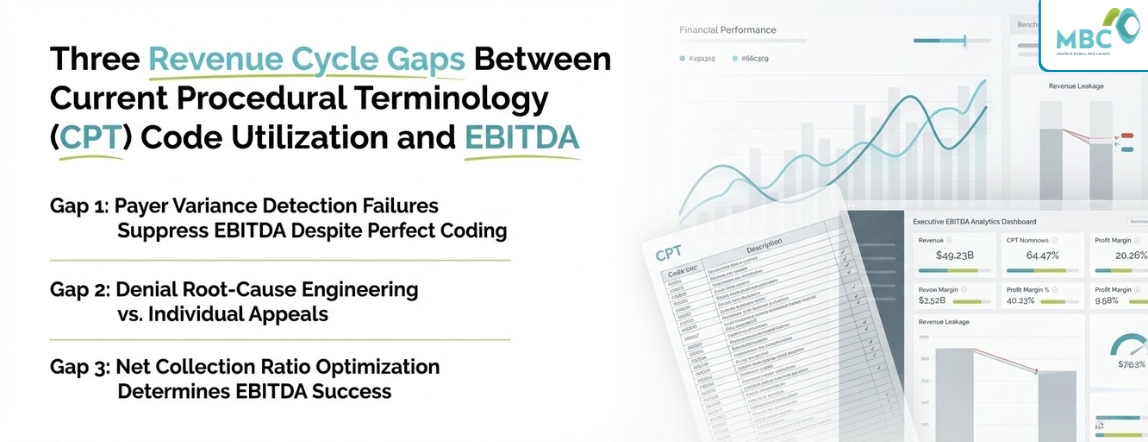
Gap 1: Payer Variance Detection Failures Suppress EBITDA Despite Perfect Coding
Perfect Current Procedural Terminology (CPT) code utilization means nothing when payers deny properly coded claims due to payer-specific policies. Commercial Payer Variance Impact on EBITDA: Medicare: Approves properly coded claims with standard documentation
- Denial rate: 6–8%
- Net collection ratio: 96–98%
UnitedHealthcare: Denies 38–42% of claims requiring additional payer-specific modifier documentation beyond standard Current Procedural Terminology (CPT) code utilization
- Initial denial rate without payer-specific protocols: 38–42%
- Revenue leakage per $3M monthly collections: $1.14M–$1.26M annually
Aetna: Accepts CPT codes but requires pre-authorization timelines different from Medicare
- Denial rate without pre-auth: 32–45%
- Cash flow impact: 60–90 day payment delays requiring working capital borrowing
EBITDA Impact: Without payer variance detection, practices experience:
- 28–42% commercial payer denial rates on properly coded services
- 60–90 day payment delays requiring working capital borrowing
- $1.2M–$2.8M annual EBITDA suppression for $3M–$5M monthly collections
Gap 2: Denial Root-Cause Engineering vs. Individual Appeals
Most practices treat denials as individual problems rather than systematic patterns—focusing on Current Procedural Terminology (CPT) code utilization accuracy without addressing why properly coded claims get denied. Table 2: Denial Management Approach Impact on EBITDA
| Approach | Monthly Denials ($3M Collections) | Appeals Pursued | Recovered Revenue | Annual Recovery |
| Individual Appeals | $540,000 (18%) | $81,000–$135,000 | $28,350–$60,750 | $340,200–$729,000 |
| Denial Root-Cause Engineering | $240,000 (8%) | $180,000–$204,000 | $129,600–$179,520 | $1,555,200–$2,154,240 |
EBITDA Growth Differential: $1.2M–$1.4M annually Denial Root-Cause Engineering Methodology:
- Systematic analysis of denial codes by payer, procedure, and provider
- Identification of documentation gaps causing patterns
- Upstream prevention of denial root causes
- Appeal rate: 75–85% of viable denials
- Overturn rate: 72–88%
Medical Billers and Coders’ 25+ years of experience deliver denial root-cause engineering protocols that move EBITDA, not just Current Procedural Terminology (CPT) code utilization volume.
Gap 3: Net Collection Ratio Optimization Determines EBITDA Success
Net Collection Ratio (NCR) measures actual collections vs. contractually collectible revenue—the true indicator of revenue cycle effectiveness, independent of Current Procedural Terminology (CPT) code utilization. NCR Formula: NCR = (Total Payments) ÷ (Total Charges – Contractual Adjustments – Policy-Based Denials) Table 3: NCR Impact on EBITDA by Practice Size
| Monthly Collections | Poor NCR (82%) | Good NCR (94%) | Excellent NCR (98%) | Annual EBITDA Difference |
| $1M–$2M | $984,000–$1,968,000 | $1,128,000–$2,256,000 | $1,176,000–$2,352,000 | $192,000–$384,000 |
| $2M–$3M | $1,968,000–$2,952,000 | $2,256,000–$3,384,000 | $2,352,000–$3,528,000 | $384,000–$576,000 |
| $3M–$5M | $2,952,000–$4,920,000 | $3,384,000–$5,640,000 | $3,528,000–$5,880,000 | $576,000–$960,000 |
Moving from 82% NCR to 98% NCR results in $192,000–$960,000 in annual EBITDA improvement without changing Current Procedural Terminology (CPT) code utilization volume.
Technological Efficiency: Revenue Cycle vs. CPT Code Utilization Systems
Practices invest heavily in Current Procedural Terminology (CPT) code utilization technology (CAC, AI coding assistants) while neglecting revenue cycle technological efficiency that actually drives EBITDA. Technology Investment ROI Comparison: CPT Code Utilization Technology: $180,000–$420,000 annually
- Improves coding accuracy from 92% to 96%
- Minimal EBITDA impact if denials and collections remain poor
- ROI: 1.2–1.8x
Revenue Cycle Technology: $240,000–$520,000 annually
- Automated eligibility verification prevents denials
- Real-time claim scrubbing with payer-specific edits
- Denial analytics identifying root causes
- Automated appeal generation
- EBITDA impact: $1.2M–$2.8M improvement
- ROI: 4–7x
Risk Mitigation Strategy: Practices should prioritize technological efficiency in the revenue cycle over Current Procedural Terminology (CPT) code utilization technology, as revenue cycle automation delivers a 3–5x higher EBITDA impact per dollar invested.
Financial Performance Metrics That Actually Move EBITDA
Beyond Current Procedural Terminology (CPT) code utilization—The Metrics Boards Track: Days in A/R:
- Excellent: 22–28 days
- Average: 38–45 days
- Poor: 55–68 days
- EBITDA impact: Each 10-day reduction frees $1M+ working capital for $3M monthly collections
Net Realized Revenue Growth:
- Measures year-over-year growth in actual collections (not charges)
- Target: 8–12% annual growth minimum
- Driven by NCR improvement, not Current Procedural Terminology (CPT) code utilization volume increases
Clean Claim Rate:
- Target: 95–98% first-pass acceptance
- Current national average: 78–85%
- Gap creates rework costs, suppressing EBITDA
Appeal Success Rate:
- Best practice: 75–88% overturn rate
- National average: 35–45%
- Difference: $1.2M–$1.4M annual EBITDA impact
Medical Billers and Coders’ system-agnostic approach implements financial performance metrics dashboards tracking EBITDA drivers, not just Current Procedural Terminology (CPT) code utilization statistics.
Move Your EBITDA Beyond CPT Code Utilization Excellence
If your practice, which collects $1M–$5M+ monthly, achieves high Current Procedural Terminology (CPT) code utilization accuracy but experiences stagnant or declining EBITDA, revenue cycle gaps—not coding deficiencies—suppress your financial performance metrics.
Medical Billers and Coders, the leading medical billing company in the USA with 25+ years of experience, moves EBITDA through comprehensive Medical Billing Services, Old AR Recovery, RCM Services, and Denial Management Services—all managed by a dedicated account manager using your existing EMR without system changes.
Our infrastructure delivers payer variance detection protocols reducing commercial denials from 28–42% to 8–12%, denial root-cause engineering recovering $1.2M–$1.4M annually vs. individual appeals, net collection ratio optimization moving NCR from 82% to 98% ($192,000–$960,000 annual EBITDA improvement), Days in A/R reduction freeing working capital, and technological efficiency in revenue cycle automation delivering 4–7x ROI vs.
Current Procedural Terminology (CPT) code utilization technology alone. With proven 30% A/R reduction, driving measurable EBITDA and net realized revenue growth, we deliver financial performance that actually moves the board beyond CPT code utilization metrics.
Request your EBITDA Impact Assessment to quantify the exact revenue cycle gaps suppressing your EBITDA despite strong Current Procedural Terminology (CPT) code utilization and identify which operational changes deliver the fastest improvement in financial performance metrics.
Contact Medical Billers and Coders today to implement revenue cycle infrastructure that moves EBITDA—because boards care about EBITDA, not CPT code utilization volume.
Frequently Asked Questions
No—practices achieve 96% Current Procedural Terminology (CPT) code utilization accuracy with 800 monthly procedures yet realize only 74% NCR and 13.5% EBITDA, while practices with 94% accuracy billing 600 procedures achieve 95% NCR and 30% EBITDA (2.5x higher) through superior payer variance detection and denial root-cause engineering.
Payer variance detection affects EBITDA 3–5x more than Current Procedural Terminology (CPT) code utilization improvements, because commercial payers deny 38–42% of properly coded claims without payer-specific protocols, resulting in $1.2M–$2.8M in annual EBITDA suppression despite perfect coding accuracy.
Current Procedural Terminology (CPT) code utilization measures technical billing correctness, while net collection ratio measures actual cash collected vs. collectible revenue—practices achieve 95%+ coding accuracy but 82% NCR when payer variance and denial failures leave $1.2M–$1.4M uncollected annually, directly suppressing EBITDA independent of coding quality.
Revenue cycle technology delivers 4–7x higher EBITDA ROI ($1.2M–$2.8M improvement) vs. Current Procedural Terminology (CPT) code utilization technology’s 1.2–1.8x ROI because revenue cycle automation addresses payer variance, denial root-cause engineering, and NCR optimization—the actual EBITDA drivers beyond coding accuracy.
Net Collection Ratio (94–98% target), Days in A/R (22–28 days freeing $1M+ working capital per 10-day reduction), net realized revenue growth (8–12% annual), clean claim rate (95–98%), and appeal success rate (75–88% creating $1.2M–$1.4M annual difference) directly correlate with EBITDA while Current Procedural Terminology (CPT) code utilization correlates only with gross charges.
References
- Centers for Medicare & Medicaid Services. (2024). Medicare physician fee schedule and revenue cycle performance standards. U.S. Department of Health and Human Services.
- U.S. Department of Health and Human Services. (2024). Health care payment learning and action network: Alternative payment model framework.
Catering to more than 40 specialties, Medical Billers and Coders (MBC) is proficient in handling services that range from revenue cycle management to ICD-10 testing solutions. The main goal of our organization is to assist physicians looking for billers and coders, at the same time help billing specialists looking for jobs, reach the right place.
