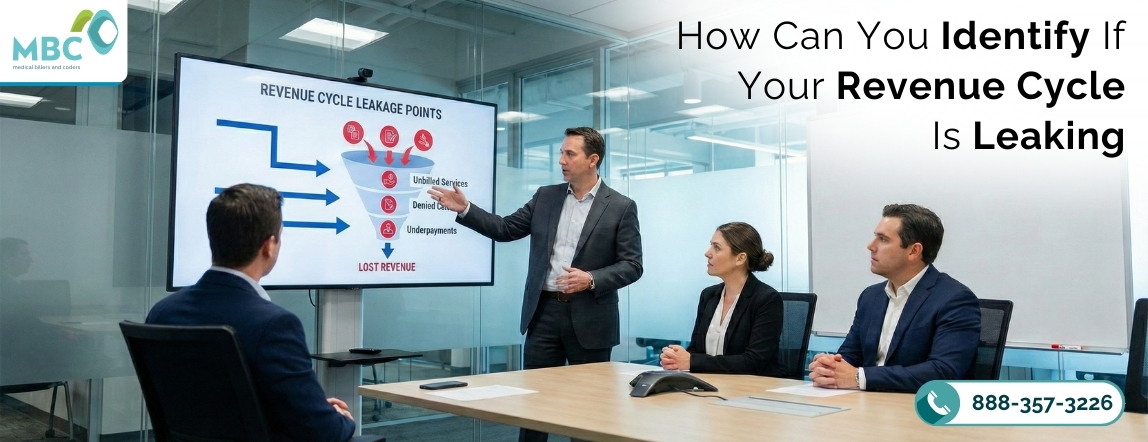
Your revenue cycle is leaking—and the answer is that most healthcare organizations are losing 8-12% of earned revenue through preventable denials, payer underpayments, aging accounts receivable, and operational inefficiencies, but they don’t know it’s happening because the bleeding occurs invisibly across thousands of denied claims and systematic payer underpayments buried in spreadsheets. When your revenue cycle is leaking, the financial hemorrhage goes unnoticed while leadership focuses on clinical excellence, yet money quietly disappears through gaps that indicate your revenue cycle is leaking at rates most organizations never quantify. For a $50M health system, that’s $4-6M annually vanishing when the revenue cycle is leaking at standard rates. The critical problem: most organizations don’t measure it, accept generic vendor quotes without understanding performance, and assume their revenue cycle is leaking imperceptibly until an audit reveals the damage.
For a $50M health system, that’s $4-6M annually vanishing into accounts receivable, payer denials, and underbilling when the revenue cycle is leaking at standard rates. For a $10M medical group, it’s $800K–$1.2M annually, leaving money on the table. This isn’t a billing problem. It’s an enterprise financial hemorrhage.
Yet most organizations don’t measure it. They don’t benchmark against industry standards. They accept generic quotes from billing vendors without understanding their actual performance. They assume their revenue cycle is working fine.
It’s not. The reality is that when your revenue cycle is leaking, you’re losing money systematically every single day.
The Payer Performance Audit: Quantifying Your Revenue Leakage
Generic billing vendor quotes tell you nothing about performance. They don’t reveal:
- What percentage of your claims are being denied? Industry standard <4%. Are you at 7-10%?
- Are specific payers underpaying you systematically? One commercial payer might be paying 15% below contract rates, while you’ve never noticed.
- How long is your cash sitting in aging AR? Industry standard 26-30 days. Are you at 45-60 days?
- Which specific denial categories are costing you the most? Prior authorization? Bundling edits? Documentation gaps?
Without this data, you’re operating blind.
Revenue Cycle Performance Benchmarks: How You Compare
| Key Performance Indicator (KPI) | Industry Average | Excellence Standard | When Revenue Cycle Is Leaking |
| Clean Claims Ratio | 85-91% | 95-98% | <85% |
| Net Collection Rate (NCR) | 90-94% | 95-98% | <90% |
| Days in Accounts Receivable | 35-45 days | 26-30 days | 50+ days |
| Denial Rate | 8-12% | 3-5% | 12%+ |
| Cost-to-Collect | 12-14% | 4-8% | 14%+ |
| Appeal Overturn Rate | 45-55% | 78%+ | <45% |
The MBC Payer Performance Audit provides enterprise-grade visibility into your revenue cycle by analyzing your actual billing performance across five critical dimensions:
1. Denial Rate Analysis by Category & Payer
Every denied claim represents revenue you’ve already earned but aren’t collecting. Understanding denial patterns reveals where revenue is leaking.
Technical Analysis:
- Denial categorization: Prior authorization gaps, coding errors, bundling violations, medical necessity disputes, coverage exclusions, documentation deficiencies, duplicate billing
- Payer-specific analysis: Which payers have disproportionate denial rates? Commercial payer A denies 12% of claims. Commercial payer B denies 3%. Same procedures. Different payer policies.
- Denial trending: Are denial rates increasing, stable, or decreasing? Trending reveals whether problems are systemic or improving.
- Denial dollar impact: Total revenue dollars denied annually. $100K in denials? $500K? $2M?
MBC Approach: Audit analyzes 3-12 months of historical claims data to identify denial patterns. Result: Organizations discover which payer relationships are costing them the most revenue and which specific denial categories require immediate intervention.
Example Finding: One health system discovered that a major commercial payer was denying 18% of orthopedic surgery claims due to incorrect modifier application. Audit identified the specific modifier error (misapplied -59 modifiers). Correction recovered $340K in previously denied revenue within 90 days.
2. Net Collection Rate (NCR) vs. Industry Benchmark
Net Collection Rate measures the percentage of charges that actually convert to collected revenue. It reveals systematic underpayment and inefficiencies in collections.
Calculation: (Collections / Gross Charges) × 100
Industry Benchmark: 95-98%
What This Reveals:
- NCR <90% indicates major collection problems (denials, write-offs, underbilling)
- NCR 90-95% indicates moderate collection issues
- NCR 95-98% indicates industry-standard performance
- NCR >98% indicates exceptional collection efficiency
MBC Audit Analysis:
- Compares your NCR against health system benchmarks in your specialty/geography
- Identifies whether underperformance is due to denials, underbilling, or improper write-offs
- Benchmarks each payer separately (payer A achieving 96% NCR, payer B achieving 88%)
- Quantifies the revenue gap between your NCR and the industry standard
Example Finding: A medical group with 92% NCR appeared to be performing well. Comparison to peer groups revealed they should be at 96% NCR. The 4-point gap represented $1.2M annual revenue leakage. Audit identified the gap came from three sources: (1) 6% payer underpayment systematic underpayment, (2) 2% inappropriate write-offs, (3) 1% abandoned denials.
3. Days in Accounts Receivable (A/R) Breakdown
Days in A/R measures how long cash remains in accounts receivable before collection. Elevated days in A/R indicate cash flow problems, collection inefficiencies, or stalled claims.
Industry Benchmark: 26-30 days
What Elevated Days in A/R indicate:
- 30-40 days: Slightly elevated, minor optimization needed
- 40-50 days: Significant collection issues requiring attention
- 50+ days: Serious cash flow crisis needing immediate intervention
MBC Audit Analysis:
- Breaks down A/R by aging category (0-30 days, 31-60 days, 61-90 days, 90+ days)
- Identifies percentage of AR in each category (healthy: 80%+ in 0-30 days)
- Analyzes claims 60+ days old (why haven’t they been resolved?)
- Benchmark your days in A/R against peer organizations
Example Finding: A health system reported 42 days in A/R. The audit breakdown revealed that 60% of AR was in the 31-60-day category and 15% was 90+ days old. Investigation found that denials were rarely being appealed—they were simply written off. Implementing a systematic denial appeal process reduced days in A/R to 28 days and recovered $480K in previously abandoned claims.
4. Payer Underpayment Screening (Contracted Rate Variance)
Payers systematically underpay healthcare organizations. Sometimes it’s a systematic policy. Sometimes it’s billing errors. Either way, organizations don’t notice because the underpayment happens across thousands of claims, $50-500 here and there.
Technical Analysis:
- Contract rate verification: What does your contract specify for each procedure code?
- Actual payment analysis: What are payers actually paying?
- Variance identification: Where is the actual payment below the contract rate?
- Dollar quantification: How much annual revenue is this underpayment costing?
MBC Approach: Analyzes 3-12 months of claims, matches each procedure code to contracted rate, identifies variances, and quantifies annual impact.
Example Finding: One medical group contract with a major commercial payer specified a $180 facility fee for orthopedic surgery procedures. The audit found the payer was underpaying by $165 (8%). Across 240 annual cases, that’s $3,600 annual underpayment. Across the health system’s 15-facility network, the same underpayment pattern resulted in $54,000 in annual underpayment. Contract renegotiation recovered the full amount.
Actionable Recommendations: Your Roadmap to Revenue Recovery
The MBC Payer Performance Audit doesn’t just identify leakage—it provides a prioritized roadmap to close it.

Typical audit recommendations include:
- Denial reduction initiatives (specific actions to reduce the denial rate by 2-4 points)
- Payer contract renegotiations (leveraging benchmark data showing underpayment)
- Billing process optimization (addressing systemic coding or documentation gaps)
- Collections process improvements (accelerating aging A/R resolution)
- Technology implementation (automation to prevent future revenue leakage)
Critical Point: Actionable recommendations are provided regardless of whether you partner with MBC. The audit is designed to give you enterprise-grade visibility into your revenue cycle performance. You can implement the recommendations independently or partner with MBC to execute them.
Full-Cycle RCM Infrastructure: Maximizing Net Realized Yield
Understanding revenue leakage is the first step. Fixing it requires enterprise-grade RCM infrastructure designed to:
- Reduce Total Cost-to-Collect (TCC): Healthcare organizations spend 12-14% of collections on internal billing operations. Full-cycle RCM infrastructure reduces this to 4-8% through automation, process optimization, and scale efficiency.
- Maximize Net Realized Yield (NRY): NRY is the revenue actually received after accounting for all deductions (denials, write-offs, contractual adjustments). Full-cycle RCM maximizes NRY by preventing denials, recovering abandoned claims, and optimizing payer contracts.
- Accelerate Cash Conversion: Full-cycle RCM infrastructure ensures clean claims are submitted quickly, denials are resolved rapidly, and cash is converted within 26-30 days, improving cash flow and working capital efficiency.
The Three Components of Full-Cycle RCM
| RCM Component | Activity | Expected Outcome |
| Front-End Optimization | Real-time insurance verification, automated prior authorization, patient financial estimation, and pre-visit data validation | Eliminates pre-authorization denials; improves patient satisfaction |
| Middle-Cycle Excellence | Clinical documentation validation, intelligent coding with AI, pre-claim NCCI/bundling screening, automated claim submission | 98.2% clean claim rate; reduces rework by 90%+ |
| Back-End Recovery | AI-powered denial prediction, systematic denial appeals, aging A/R resolution, payer contract monitoring | 78%+ denial overturn rate; $600K-$2M annual recovery |
Why Most Organizations Don’t Know They’re Leaking Revenue
Three reasons:
1. Lack of Visibility: Most healthcare organizations use legacy billing systems that don’t provide KPI dashboards. Leadership doesn’t see denial rates, NCR trends, or days in A/R metrics. “What gets measured gets managed,”—and most organizations aren’t measuring.
2. Vendor Misalignment: Billing vendors are incentivized by claims processed, not revenue collected. They have no motivation to identify $2M in systematic payer underpayment unless you ask them to.
3. Complexity Overwhelming: Healthcare billing is complex. Organizations assume problems are “just how healthcare billing works” rather than preventable inefficiencies.
The Payer Performance Audit cuts through this complexity. It provides objective, data-driven visibility into revenue cycle performance with actionable recommendations.
The Bottom Line: Your Revenue Cycle Is Leaking
Every healthcare organization loses revenue to preventable denials, payer underpayments, and operational inefficiencies. The question isn’t whether your organization is leaking revenue.
The question is: How much?
The Payer Performance Audit answers that question with objective, data-driven analysis. You get enterprise-grade visibility into your revenue cycle performance, benchmarking against industry standards, and a prioritized roadmap to close revenue leaks.
Most importantly, you make decisions based on facts, not assumptions.
Ready to Quantify Your Revenue Leakage?
Request your complimentary Payer Performance Audit and discover exactly where your revenue is being left on the table.
No obligation. No sales pitch. Just objective data.
Contact Medical Billers and Coders
Medical Billers and Coders specializes in full-cycle revenue cycle management for health systems and large medical groups. 25+ years of experience. Enterprise-grade RCM infrastructure. Revenue Integrity discipline. Contact us today: Phone: +1-888-357-3226 | Email: info@medicalbillersandcoders.com.
We don’t process claims. We optimize yield.
Frequently Asked Questions
The audit is complimentary for organizations with $5M+ annual revenue or 20+ providers. No obligation. No sales pressure. Just objective data about your revenue cycle performance. MBC operates on the principle that transparency builds trust—and organizations armed with data make better decisions.
MBC requests 3-12 months of historical claims data in standard format (ERA files, EOB data, or claim-level transaction logs). Data is processed under strict HIPAA compliance protocols. Personally identifiable information is removed from analysis—the audit focuses purely on billing performance metrics and payment patterns.
Typical audit timeline: 2-3 weeks from data receipt to final report delivery. Complex health systems with multiple billing systems may require 4-6 weeks.
Yes and no. MBC compares actual payments against CMS published rates (Medicare) and market benchmarks (commercial). This reveals whether payments appear reasonable. To confirm underpayment relative to your specific contract, MBC needs access to your payer contracts. Most organizations are comfortable sharing contracts under NDA.
No. Recommendations are provided regardless. You can implement changes independently, hire a different vendor, or bring recommendations internally to your billing team. The audit’s value is providing objective visibility into performance—what you do with that information is entirely your decision.
The Payer Performance Audit is focused and specific: analyzing historical claims data to quantify revenue leakage and identify root causes. Consultants typically provide broader organizational assessments. The audit is designed to be fast (2-3 weeks), focused (revenue cycle only), and actionable (specific recommendations).
Organizations typically recover $300K-$2M annually in Year One, depending on their starting position. Health systems with significant denial rates or collection issues tend to see higher recovery rates. Organizations already at industry benchmarks see more modest improvements.
Yes. Benchmark data showing systematic underpayment is powerful leverage in payer negotiations. One health system used audit findings to renegotiate a commercial contract, recovering $140K annually in facility fee adjustments alone.
Revenue leakage affects all organizations equally. A 5-provider practice losing 5% of gross revenue may have $ 250 K to $500K in annual leakage. The audit methodology scales to any organization size. However, MBC focuses on organizations with $5M+ annual revenue, where the audit findings typically justify the analytical effort.
MBC provides a written report with findings, recommendations, and a quantification of financial impact. Many organizations implement recommendations internally. Others partner with MBC for full-cycle RCM execution. Either way, you have objective data informing your decision.
References & Government Citations
- Centers for Medicare & Medicaid Services (CMS): National Correct Coding Initiative (NCCI)
- U.S. Department of Health & Human Services (HHS): Healthcare Provider Compliance Resources
- Medicare.gov: Check Claim Status and Appeals
- American Medical Association (AMA): Coding and Billing Resources

With almost 12 years of experience in healthcare revenue cycle management, this Revenue Cycle Specialist brings deep expertise in medical billing, claims optimization, and practice profitability. Shares industry-backed insights focused on improving collections, reducing denials, and driving operational excellence.