
Yes, a 90-Day AR Diagnostic is worth the investment because it systematically identifies 8–12% revenue leakage ($150,000 to $3M+ annually for most healthcare organizations) caused by payer underpayments, preventable denials, and aging AR write-offs.
The diagnostic provides a precise, data-driven roadmap showing exactly where revenue is lost, which payers are underperforming, and which operational breakdowns are costing your organization six to seven figures annually in recoverable revenue.
The Problem with Standard AR Reports
Most health systems rely on blunt measurement tools: total Days in AR, aging buckets, and collection percentage. These aggregate metrics obscure the underlying issues.
Example: A facility might report 42 Days in AR while simultaneously losing $240,000 annually to a single commercial payer’s systematic underpayment of facility fees. This pattern remains invisible in summary reports but becomes immediately apparent in a properly structured diagnostic.
Why 90 Days Matter
The 90-day window is the operational threshold at which revenue transitions from “collectible with effort” to “likely permanent loss.”
According to CMS, the timely filing limit for most Medicare claims is one year from the date of service, but commercial payers typically impose 90–180-day limits. Revenue in the 61–90-day bucket has already consumed collection resources without yielding and faces an exponentially declining recovery probability.
Three Hidden Revenue Leakage Mechanisms
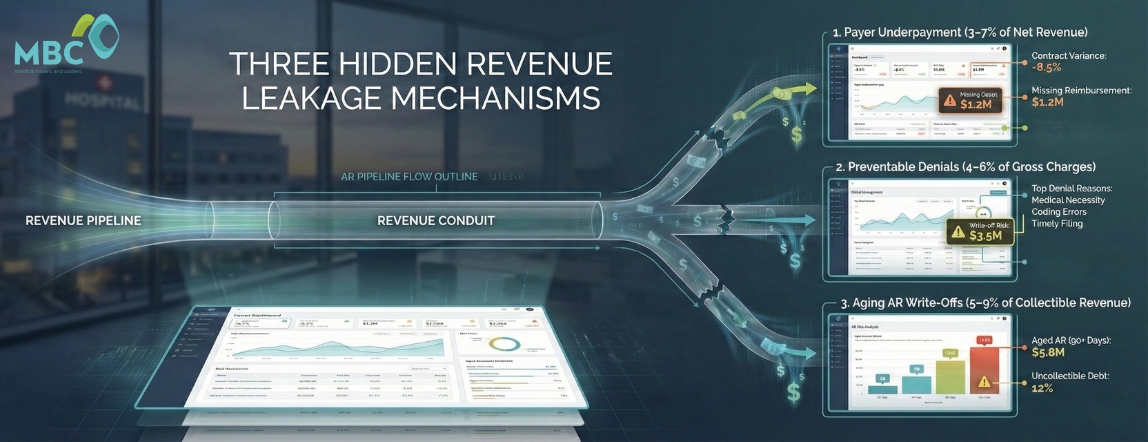
1. Payer Underpayment (3–7% of Net Revenue)
Commercial contracts specify reimbursement rates, but actual payments frequently fall below contracted amounts due to:
- Incorrect fee schedule application
- Missing modifiers
- Bundling edits applied without contractual authority
The Problem: These underpayments remain undetected without systematic payer variance analysis comparing expected reimbursement to actual payment at the CPT and modifier level.
2. Preventable Denials (4–6% of Gross Charges)
The Office of Inspector General reports that Medicare Advantage Organizations denied 18% of prior authorization requests in 2022 that would have been covered under Traditional Medicare.
The Gap: Multi-specialty groups face similar denial rates across commercial payers, with 60–70% of denials overturnable on appeal but only 30–40% actually worked due to resource constraints.
3. Aging AR Write-Offs (5–9% of Collectible Revenue)
Claims migrating past 120 days represent systematic operational failures:
- Missing information is never corrected
- Denials never appealed
- Patient balances were never pursued
The Data: Healthcare Financial Management Association (HFMA) benchmarks indicate collection probability drops to 15% once claims reach 180 days, yet many organizations carry AR in the 180+ bucket, representing 12–18% of total receivables.
Table 1: Revenue Leakage Mechanisms and Detection Methods
| Leakage Type | Average Impact | Primary Cause | Diagnostic Indicator |
| Payer Underpayment | 3–7% of net revenue | Contract variance, incorrect fee schedules | Payment-to-expected variance >2% |
| Preventable Denials | 4–6% of gross charges | Missing documentation, authorization gaps | Initial denial rate >8% |
| Aging AR Write-Offs | 5–9% of collectible revenue | Process breakdowns, resource gaps | AR >120 days exceeding 15% |
The Four-Layer Diagnostic Framework
Layer 1: Aging Bucket Segmentation by Payer Class
Standard aging reports (0–30, 31–60, 61–90, 91–120, 120+) must be stratified by payer to identify which payers consistently age claims.
What This Reveals: If UnitedHealthcare commercial claims concentrate in 61–90 days while Aetna claims are clear in 0–30 days, you have either systematic authorization issues with UHC or resource allocation problems.
Layer 2: Denial Reason Code Analysis
Every denial generates a CARC (Claim Adjustment Reason Code) and RARC (Remittance Advice Remark Code).
Key Denial Categories:
- CO-16 (“Claim lacks information”) = Front-end registration failures
- CO-197 (“Precertification absent”) = Authorization breakdowns
- CO-4 (“Procedure code inconsistent with modifier”) = Coding errors
Medical Billers and Coders’ enterprise RCM infrastructure categorizes 40+ denial reasons into seven root cause families, enabling targeted operational fixes rather than generic “work denials harder” directives.
Layer 3: Clean Claim Rate by Specialty and Facility
A health system might report 94% clean claim rate while the interventional radiology service operates at 78% due to complex bundling rules and implant documentation requirements.
The Value: Specialty-level clean claim analysis identifies which service lines require coding protocol enhancement versus which face systematic payer policy issues.
Layer 4: Payer-Specific Reimbursement Variance
This requires contract modeling capability—building expected reimbursement based on fee schedules and then calculating variance for each remittance.
Example Impact: A 5% underpayment rate on facility fees for observation services might represent $180,000 annually for a 200-bed hospital, yet remain invisible without CPT-level variance tracking.
The Six-Week Diagnostic Execution Process
Weeks 1–2: Data Extraction and Normalization
Claims Data Required:
- Date of service
- CPT/HCPCS codes and modifiers
- Charges and expected reimbursement
- Actual payments and adjustments
- Denial codes and current aging bucket
- Payer and specialty information
Data Volume: This typically contains 200,000–2,000,000 records for health systems, requiring a normalized data architecture rather than Excel exports.
Contract Analysis: Pull payer contracts for the top 10 commercial payers by volume. Extract fee schedules, case rate agreements, percentage-of-Medicare provisions, and special provisions. This manual process takes 40–60 hours for complex multi-entity health systems.
Weeks 3–4: Pattern Analysis and Root Cause Identification
Calculate Payer-Specific Metrics:
- Clean claim rate
- Initial denial rate
- Average Days in AR by payer
- Payment-to-expected variance
- Overturn rate on appealed denials
Segment by Specialty: Identify service line-specific issues.
Categorize Denials:
- Preventable denials (CO-16, CO-197) = Operationally fixable through front-end workflow improvements
- Payer policy denials (CO-50, CO-96) = Require different intervention strategies
Table 2: Sample 90-Day AR Diagnostic Output – Commercial Payer Performance
| Payer | Monthly Volume | Clean Claim Rate | Initial Denial Rate | Avg. Days in AR | Payment Variance | Est. Annual Leakage |
| UnitedHealthcare | $2.4M | 89.2% | 14.3% | 47 days | -3.8% | $127,000 |
| Aetna | $1.8M | 95.1% | 6.2% | 28 days | -1.2% | $28,000 |
| Cigna | $1.6M | 91.4% | 9.8% | 38 days | -2.9% | $62,000 |
| BCBS Local | $3.2M | 93.7% | 7.1% | 32 days | -4.2% | $156,000 |
| Humana | $1.1M | 88.6% | 15.7% | 52 days | -2.1% | $41,000 |
Weeks 5–6: Leakage Quantification and Operational Recommendations
Calculate Key Metrics:
- Total Collectible Revenue (TCR): Gross charges minus contractual adjustments and policy-based denials
- Net Realizable Yield (NRY): Actual collections divided by TCR
The Gap Represents Recoverable Revenue
For a $50M health system with 94% NRY, the 6% gap represents $3M in annual leakage:
- $1.2M to payer underpayments
- $1.1M to preventable denials never appealed
- $700K to aging write-offs from process breakdowns
Develop Targeted Recommendations:
- Implement real-time eligibility verification to reduce CO-16 denials
- Build authorization tracking workflows to eliminate CO-197 denials
- Establish CPT-level variance monitoring to contest underpayments within 30 days
- Create specialty-specific coding protocols for high-complexity service lines
Converting Diagnostic Findings Into Operational Infrastructure
The diagnostic reveals what is broken. Infrastructure fixes how it operates going forward.
Real-Time Variance Alerts
Configure RCM systems to flag payments deviating >5% from contracted rates within 48 hours of remittance posting.
Why This Matters: Most organizations discover underpayments 90+ days after payment when appeal rights have expired. Real-time alerts enable immediate appeals while claims remain within payer correction windows.
Denial Prevention Protocols
For denial types exceeding 2% of volume, build upstream prevention workflows.
Example: If CO-197 (authorization) denials exceed the threshold, implement real-time authorization verification in scheduling systems with hard stops preventing case scheduling without authorization number capture.
Payer-Specific Escalation Pathways
Some payers exhibit systematic patterns requiring executive-level intervention rather than claim-by-claim appeals.
When to Escalate: When UnitedHealthcare shows a 14.3% initial denial rate versus 6.2% for Aetna (see Table 2), the solution isn’t to escalate denials further—it’s for senior leadership to engage UHC provider relations to address systemic policy application issues.
Specialty Coding Support
Service lines with clean claim rates below 92% require enhancements to the coding protocol.
The Fix: ASC facilities performing complex multi-procedure cases need ASC-certified coders who understand NCCI edits, modifier application, and bundling rules specific to surgical specialties. Generalist coders applying evaluation and management coding logic to surgical cases generate systematic denials.
Why Traditional AR Aging Reports Fail CFOs
Traditional AR aging reports aggregate all receivables into time buckets without distinguishing:
- Collectible revenue from uncollectible balances
- Contracted adjustments from payment variance
- Operational failures from payer policy denials
What CFOs Can’t See in Standard Reports
A CFO reviewing an AR report showing 42 Days in AR and $4.2M in the 31–60 day bucket cannot determine:
- Which portion represents collectible revenue vs. contractual write-offs not yet posted
- Whether the aging stems from payer payment delays vs. internal processing backlogs
- If specific payers or specialties drive the aging concentration
- What percentage faces a timely filing deadline expiration in the next 30 days
The Diagnostic Solution
The 90-Day AR Diagnostic restructures this data into actionable business intelligence:
- Payer-specific performance metrics
- Denial root cause attribution
- Reimbursement variance quantification
- Service line-specific clean claim rates
This transforms AR from an accounting report into an operational management tool.
Medical Billers and Coders’ enterprise RCM platform delivers this intelligence through CFO-grade, daily-updated dashboards, enabling executives to monitor Net Realizable Yield, payer variance trends, and denial overturn rates without requesting custom reports from revenue cycle staff.
Table 3: Traditional AR Reporting vs. Diagnostic-Driven Intelligence
| Metric Type | Traditional AR Report | 90-Day Diagnostic Output | Operational Value |
| Days in AR | 42 days (aggregate) | 28 days (Aetna) vs. 52 days (Humana) | Identifies payer-specific payment delays requiring escalation |
| Aging Buckets | $4.2M in 31–60 days | $1.8M collectible, $2.4M pending contractual adjustments | Separates actionable revenue from accounting entries |
| Denial Rate | 11% of charges were denied | 6.2% preventable + 4.8% payer policy | Directs resources to fixable operational issues |
| Collection % | 94% of charges collected | 94% NRY with $3M identified leakage | Quantifies recoverable revenue by root cause |
From Diagnostic to Continuous Performance Management
The 90-Day AR Diagnostic serves as the baseline assessment. Sustainable margin protection requires converting diagnostic findings into continuous monitoring infrastructure.
Monthly Payer Scorecarding
Track these metrics by payer every month:
- Clean claim rate
- Days in AR
- Payment variance
- Denial rate
Establish Tolerance Thresholds:
- Payment variance >2% triggers contract review
- Denial rate >8% initiates payer relations engagement
This shifts from reactive problem-solving to proactive payer performance management.
Denial Root Cause Trending
Monitor denial reason code distribution monthly to identify emerging patterns.
Early Warning System: A sudden increase in CO-4 (procedure/modifier mismatch) denials signals either a coding protocol breakdown or a payer policy change requiring immediate investigation.
Net Realizable Yield Tracking
Calculate NRY monthly by payer and specialty.
What Declining NRY Reveals: A declining NRY despite stable volumes indicates deteriorating collection performance—either from increasing denials, growing payment variance, or rising write-offs. Early detection enables intervention before quarterly financial reviews reveal margin erosion.
The Regulatory Context: Why CMS and OIG Monitor AR Performance
CMS Oversight
CMS monitors Medicare Advantage Organization claim processing through the Medicare Advantage and Part D Oversight authority, publishing annual audit findings on:
- Denial rates
- Appeals overturn percentages
- Beneficiary access issues
Consequences: High denial rates trigger regulatory scrutiny, corrective action plans, and potential enrollment sanctions.
OIG Examination
The Department of Health and Human Services Office of Inspector General examines Medicare FFS claim denials and appeals, identifying patterns where administratively required documentation (rather than medical necessity questions) drives denials.
Cross-Application: This finding directly applies to commercial payer performance assessment. Organizations demonstrating systematic operational issues in AR management face increased audit risk.
Cash Flow Impact
For healthcare organizations accepting Medicare and Medicaid patients, AR aging directly impacts the cash flow required to maintain program participation.
Warning Signs: Extended AR cycles strain working capital, potentially forcing:
- Delayed vendor payments
- Deferred capital investments
- Increased line-of-credit utilization
All of these are indicators of financial distress that trigger heightened regulatory monitoring.
Request Your Facility Yield Audit
Identify your specific revenue leakage patterns before you sign anything. Our 90-day analysis quantifies exactly where revenue is lost, which payers are underperforming, and what operational infrastructure fixes will recover six to seven figures annually.
Schedule a CFO Briefing: Discover how health systems are recovering $150K–$3M in annual revenue through systematic AR diagnostic and infrastructure deployment.
Contact Medical Billers and Coders today to start protecting your margins with enterprise-grade Revenue Performance Management.
The Diagnostic Advantage: CPT-level, payer-specific, specialty-stratified analysis isolates these concentrated opportunities that aggregate reporting obscures.
Medical Billers and Coders’ diagnostic methodology has identified single-payer underpayment patterns worth $240K+ annually for health systems, specialty-specific coding gaps recovering $180K in preventable denials, and implant documentation failures costing orthopedic practices $2.1M per surgeon—all invisible in standard AR aging reports but immediately actionable once quantified.
Frequently Asked Questions
Standard AR aging reports only show how long claims are unpaid. A 90-Day AR Diagnostic explains why revenue is delayed by linking aging to payer behavior, denials, documentation gaps, and CPT-level reimbursement variance, turning raw AR data into actionable recovery insights.
Net Realizable Yield measures actual collections against truly collectible revenue, excluding contractual adjustments. It matters because a practice can report strong collections while still losing margin to denials, underpayments, and write-offs that gross percentages fail to reveal.
Payer-specific AR delays are driven by processing backlogs, high denial rates, authorization complexity, and fee schedule errors. These issues require targeted payer-level workflows rather than aggregated AR management.
Preventable denials persist because most organizations lack the staffing and systems to appeal every eligible claim on time. As a result, many recoverable denials age out, not due to merit, but due to operational limits.
By analyzing AR at the payer, specialty, and CPT levels, the diagnostic isolates concentrated revenue leakage that aggregate reports obscure, revealing high-value recovery opportunities hidden in routine AR metrics.
References
- Centers for Medicare & Medicaid Services. (2024). Medicare Claims Processing Manual, Chapter 1
- U.S. Department of Health and Human Services, Office of Inspector General. (2022).
- Healthcare Financial Management Association. (2023). MAP Keys.
- U.S. Department of Health and Human Services, Office of Inspector General. (2023)
Catering to more than 40 specialties, Medical Billers and Coders (MBC) is proficient in handling services that range from revenue cycle management to ICD-10 testing solutions. The main goal of our organization is to assist physicians looking for billers and coders, at the same time help billing specialists looking for jobs, reach the right place.