

 Specialities
 Services
 Resource Center
 Pricing
 About
About
 Contact
It tracks metrics like average days to payment, denial rate, and denial reason patterns broken out for each individual payer rather than combined into one practice-wide average. This makes it possible to identify which specific insurer relationships are underperforming and address them directly instead of applying a broad, generic fix across every claim.
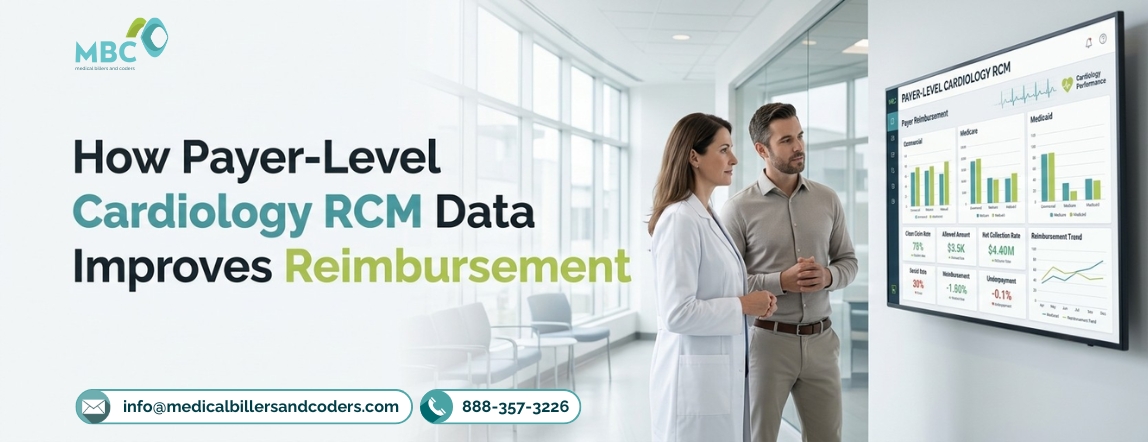
Cardiology RCM improves reimbursement when performance data gets broken down by individual payer instead of reviewed as one blended average. The direct answer: payer-level tracking shows exactly which insurers are slow to pay, which ones deny device and imaging claims most often, and which contract terms need renegotiating, insight a practice-wide average simply hides.
A blended 94% clean claim rate can mask one payer paying at 78% while five others perform well above target. Cardiology RCM built around payer-specific data turns that hidden gap into a fixable problem instead of a mystery buried in a monthly summary.
Why Blended Averages Hide Payer-Specific Problems
Most practices track billing performance as a single number each month, but that approach flattens real differences between payers into a misleading average. Cardiology RCM data broken out by payer reveals that a commercial plan denying 15% of cath lab claims can be masked entirely by strong performance from Medicare and two other commercial payers.
Without payer-level visibility, a practice might never identify which specific relationship is quietly costing the most revenue — and by the time the pattern shows up in a blended report, months of underpayment have often already passed.
What Payer-Level Cardiology RCM Data Reveals
Breaking RCM data down by payer allows practices to evaluate several important performance indicators:
- Average days to payment
- Denial rate
- Denial reasons
- Net collection rate
- Payment variance
- A/R aging
- Underpayment trends
- Authorization-related denials
- Documentation-related denials
- Coding and modifier-related denials
A payer that frequently denies cardiac imaging claims because of authorization requirements requires a different response from a payer that pays slowly but rarely denies claims.
Similarly, recurring underpayments may require contract or payment analysis rather than additional denial follow-up.
Payer-Level Cardiology RCM Metrics
|
Payer Segment |
What to Monitor |
What It Can Reveal |
|
Medicare |
Payment trends, denials, documentation issues |
Recurring claim and documentation problems |
|
Medicare Advantage |
Authorization, denials, payment trends |
Payer-specific authorization and reimbursement issues |
|
Commercial PPO |
Payment variance, denials, A/R aging |
Coding, modifier, bundling, or reimbursement problems |
|
Commercial HMO |
Authorization, referrals, payment trends |
Referral and authorization-related delays |
|
Other Payers |
Denials, payment speed, A/R |
Payer-specific revenue cycle patterns |
Cardiology RCM and Denial Management by Payer
Denial Management improves significantly once it's organized by payer rather than handled as one general queue. A team working denials payer by payer can apply the correction pattern that already worked on a similar claim for the same insurer, instead of researching each denial from scratch.
This is where Cardiology RCM structured around payer segmentation speeds up turnaround: known payer behavior means faster, more accurate resubmissions, and fewer claims sitting in limbo while staff figure out what went wrong from first principles.
Using Payer Data to Strengthen Old AR Recovery
Old AR Recovery becomes far more targeted once a practice knows which payers are driving aged claims. If one payer accounts for a disproportionate share of the 90-plus day bucket, that relationship deserves dedicated follow-up rather than the same generic reminder call used across every payer.
Teams that track aging by payer can prioritize recovery efforts where the dollar impact is largest instead of working claims in the order they happen to appear, which typically shortens the time it takes to clear the highest-value aged claims first.
|
Payer Segment |
Share of 90+ Day AR |
Recommended Action |
|
Top denying payer |
Often 25-35% of aged AR |
Dedicated appeals specialist |
|
Slow-paying commercial plans |
15-25% of aged AR |
Weekly status follow-up |
|
Medicare/Medicare Advantage |
10-20% of aged AR |
Documentation audit |
|
All other payers |
Remainder |
Standard monthly review |
How RCM Services and Medical Coding Services Use Payer Data
Specialty RCM Services and medical coding services rely on payer-level data to refine how claims get coded and submitted in the first place. Coders who know a specific payer consistently rejects a certain modifier combination can adjust documentation before submission rather than after denial.
Dedicated medical billing services that track this pattern across every payer relationship reduce first-pass denials more effectively than a one-size-fits-all coding approach, because the corrections are based on actual payer behavior instead of general assumptions.
Pricing and Request Your Revenue Diagnostic
The Pricing of Cardiology RCM Services depends on factors such as provider count, claim volume, payer mix, procedure complexity, reporting requirements, and the level of denial management and A/R support required. Practices with complex cardiology billing needs may require more specialized coding, payer analysis, and follow-up than standard billing arrangements.
Request your Revenue Diagnostic to identify payer-specific reimbursement gaps, denial patterns, aging A/R, payment delays, and other areas where your cardiology practice may be losing revenue.
Conclusion
Cardiology RCM improves reimbursement most effectively when payer-level data replaces blended, practice-wide averages. Segmenting performance by payer reveals exactly which relationships are driving denials, slow payment, and aging AR, information that lets billing teams apply targeted denial management and old AR recovery instead of generic fixes.
Practices that build this level of payer visibility into their RCM Services tend to see steadier reimbursement and stronger position at contract renewal time. Reviewing payer-specific trends regularly is the clearest way to know where reimbursement is actually being protected or lost.
Want to see how your payer mix compares once the data is broken out individually?
Call 888-357-3226 or email info@medicalbillersandcoders.com to Request Your Revenue Diagnostic.
