

 Specialities
 Services
 Resource Center
 Pricing
 About
About
 Contact
Start with three numbers across all sites: Net Collection Ratio, Days in AR, and denial rate by location. If any of these vary significantly site-to-site, or if you can't get a consolidated view without waiting on manual reports, your billing model likely has hidden leakage.
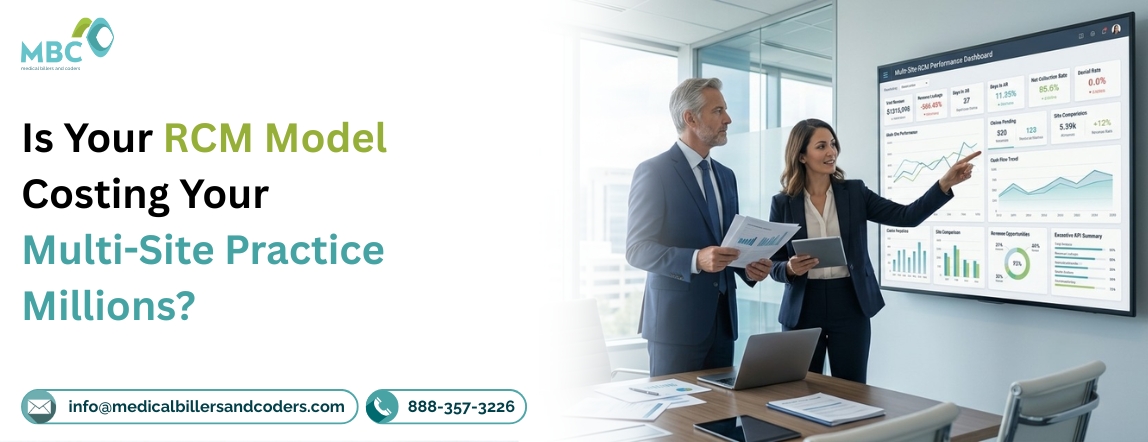
Yes, if your revenue cycle management model was built for a single location and never re-engineered for scale, it is almost certainly bleeding six or seven figures a year across denials, underpayments, and delayed cash flow. Multi-site groups and PE-backed healthcare enterprises rarely lose revenue to one dramatic failure. They lose it to dozens of small, recurring gaps in a fragmented revenue cycle model that never got redesigned as the organization grew from one location to five, ten, or twenty.
Why the Standard Revenue Cycle Management Model Breaks at Scale
A single-location revenue cycle management model can survive on manual claim scrubbing, a shared spreadsheet for AR tracking, and a biller who "knows the payers." That model collapses the moment a group crosses three, five, or ten locations. Each site brings its own payer mix, its own credentialing timelines, its own front-desk habits, and its own denial patterns, and without centralized oversight, those variances compound instead of averaging out.
The result is not one large loss. It is Days in AR creeping past 45 to 50 across the portfolio, Net Collection Ratio drifting from a healthy 96 to 98% down into the high 80s, and a CFO who cannot get a consolidated, real-time view of performance across sites without waiting on month-end reports.
For a $15M multi-site group, a five-point NCR gap alone represents roughly $750,000 in revenue that is billed but never collected. Multiply that gap across a portfolio of ten or fifteen locations and the exposure moves well into eight figures over a few years.
Where Multi-Site Practices Lose the Most Revenue
Three patterns show up consistently in multi-site revenue cycle audits.
1. Credentialing lag across new or acquired sites
Every location added through acquisition or de novo growth introduces a credentialing window during which claims are held, denied, or paid at out-of-network rates. Groups without a centralized credentialing function routinely carry six-figure exposure per new site in the first 90 to 120 days, and that exposure often goes unnoticed because it looks like normal ramp-up rather than a fixable process gap.
2. Payer contract variance
Multi-site groups frequently discover, usually during an audit rather than proactively, that different locations are reimbursed at different contracted rates for identical CPT codes under the same payer, simply because contracts were negotiated at different times by different administrators with no shared visibility into terms across the portfolio.
3. Fragmented denial management
When each site manages its own denials independently, root-cause patterns never surface at the enterprise level. A modifier error repeating across four locations looks like four unrelated problems instead of one fixable workflow gap, and it keeps recurring every billing cycle until someone centralizes the data and traces it back to its source.
Individually, none of these three gaps looks catastrophic in a monthly report. Stacked across a growing portfolio of locations, they behave less like isolated errors and more like a structural tax on every claim the organization submits, quietly compounding as the group adds sites faster than its billing infrastructure can absorb them.
In-House vs. Generic Vendor vs. Enterprise RCM Services
|
Capability |
In-House, Per-Site |
Generic RCM Services Vendor |
MBC Enterprise Model |
|
Denial pattern visibility |
Site-by-site, no rollup |
Monthly PDF reports |
Real-time, cross-site dashboard |
|
Payer contract analytics |
Rarely tracked centrally |
Limited to claim status |
Rate variance flagged by location |
|
Credentialing during growth |
Manual, reactive |
Standard turnaround |
Proactive, pre-acquisition planning |
|
Days in AR (typical) |
48 to 55 days |
38 to 45 days |
20 to 28 days |
|
CFO-level reporting |
Spreadsheets, monthly |
Static summaries |
Executive dashboard, drill-down by site |
Revenue Cycle Management Trends Multi-Site Groups Should Be Watching
The revenue cycle management trends reshaping enterprise healthcare in 2026 all point toward centralization and predictive analytics rather than more headcount. Payers continue tightening prior authorization requirements and documentation thresholds, which means denial rates rise fastest for organizations still managing collections as a per-site function rather than a coordinated system. At the same time, CMS's own program-integrity data underscores how much is at stake industry-wide.
The FY2025 Comprehensive Error Rate Testing report from CMS gov estimates roughly $28.83 billion in improper Medicare fee-for-service payments, a 6.55% improper payment rate. That level of scrutiny is exactly why a defensible, centralized model, not a patchwork of site-level workarounds, has become a compliance issue as much as a financial one.
Groups that are ahead of this shift share three habits. They consolidate coding and denial data across every location into a single system of record. They treat payer contract analytics as an ongoing function rather than a one-time negotiation event.
And they give their CFO real-time, facility-level visibility instead of month-end summaries reconstructed from spreadsheets. Generic medical billing services built for solo practices generally cannot deliver any of the three, since the infrastructure and staffing model simply weren't designed to scale that way.
What a High-Performing RCM Services Partner Actually Looks Like
A model built for multi-site scale looks different from the ground up. It centralizes credentialing so new or acquired locations aren't sitting on held claims for months. It runs payer contract analytics continuously, flagging rate variance the moment a location is underpaid relative to its own contract, not after a manual audit surfaces it a year later.
It treats denial management as a single, cross-site data set, so a modifier error at one location gets fixed everywhere at once instead of repeating across four separate sites. And it gives the CFO a dashboard, not a spreadsheet: Net Collection Ratio, Days in AR, and denial trends broken out by site and updated in real time rather than reconstructed at month-end.
This is the operational difference between transactional medical billing services designed to process claims and revenue cycle management infrastructure designed to protect enterprise margin. MBC's medical billing and coding services are structured around this model.
Review current engagement structures on our pricing page, compare specialty-specific benchmarks on our specialty index, or check regional payer and compliance considerations on our state-by-state index.
If your organization is scaling faster than your billing model can support, a facility-by-facility audit is the fastest way to find out where the money is actually going. Request a Facility Yield Audit to get a site-by-site breakdown of denial patterns, payer contract variance, and AR exposure. Call 888-357-3226 or email info@medicalbillersandcoders.com to schedule a CFO briefing.
In Summary
A billing model that worked for one location rarely survives multi-site growth intact. Credentialing lag, payer contract variance, and fragmented denial management quietly erode margin at scale, often invisibly, until a CFO asks for a consolidated view and discovers the gap. The fix isn't more staff per site. It's a centralized revenue cycle management model with real-time visibility, continuous payer contract analytics, and unified denial management across every location.
References: Comprehensive Error Rate Testing (CERT)
