In 2025, Healthy AR and Denial Rates reflect a financially stable medical practice with predictable cash flow, disciplined accounts receivable timelines, and consistently low claim rejections. For most independent practices, this means maintaining Days in Accounts Receivable under 30–35 days and keeping denial exposure below 5%, signaling strong front-end controls, accurate coding, and effective payer management.
What is changing is not the benchmark, but the difficulty of achieving it.
Across the industry, denial rates are quietly creeping toward 10–12%, and this is no longer driven by isolated billing errors or a single problematic payer. The increase is tied to payer-side automation, expanded prior authorization logic, and AI-driven medical-necessity reviews that flag claims with unprecedented precision.
For small and mid-sized practices, these pressures are not “administrative inefficiencies.” They represent a direct threat to liquidity, staffing stability, and long-term operational viability.
Understanding revenue cycle benchmarks is no longer optional or reserved for large hospital systems. In 2025, benchmark literacy is a survival skill. Without objective performance targets, practices cannot distinguish between standard payer friction and serious revenue leakage—especially in an environment dominated by high-deductible plans and algorithmic payer scrutiny.
This guide breaks down the core RCM performance indicators you must track in 2025—including Days in AR, denial exposure, and clean claim performance—across multiple specialties such as Orthopedics, ASCs, and Dermatology. By the end, you will know exactly where your practice stands and what corrective actions are required to protect earned revenue.
Bottom line:
In 2025, high-functioning practices operate with denials below 5% and Days in AR under 35–40 days. Performance outside these thresholds almost always indicates material revenue loss that requires immediate intervention.

AR and Denial Benchmarks for 2025
A denial rate is the percentage of submitted claims rejected by payers, either in whole or in part. Days in AR measures how long revenue remains outstanding before payment is received.
Best-in-Class Targets
-
Denial Exposure: < 5%
-
Days in AR: < 35 days
High-Risk Thresholds
-
Denial Exposure: > 10%
-
Days in AR: > 50 days
Understanding the Core Metrics
What Days in AR Actually Measure
Days in Accounts Receivable is the most reliable indicator of billing team effectiveness and payer responsiveness. It captures the average number of days between claim submission and payment posting.
Operationally, AR days function as your cash-flow vital sign. Elevated AR indicates revenue stalled in payer queues, medical necessity reviews, or appeal backlogs—capital that cannot be reinvested into staffing, technology, or patient care.
How to Calculate Days in AR
To compare performance against recognized benchmarks such as HFMA or MGMA standards, use the industry-accepted formula:
Days in AR = Total Accounts Receivable ÷ Average Daily Charges
Average Daily Charges are calculated as total gross charges over the past 12 months divided by 365.
Example:
If total AR equals $150,000 and average daily charges equal $3,750, Days in AR = 40.
The Real Cost of Aging AR
Claims do not age linearly—they decay.
After 60 days, the probability of full recovery drops sharply. At 90 days, claims often approach or exceed payer timely filing limits, converting earned revenue into permanent write-offs.
Beyond lost dollars, aging AR drains staff productivity. Billing teams spend disproportionate time chasing old claims instead of processing clean, high-yield submissions.
Understanding Denial Exposure
A denial is a payer’s determination that a claim does not meet reimbursement criteria. While many denials are technically appealable, rework is expensive—industry studies estimate $25 to $118 per denied claim, depending on complexity.
That cost directly erodes margins.
Initial vs. Final Denial Exposure
High-performing organizations track both:
-
Initial Denial Rate – Measures front-end accuracy (eligibility, authorizations, coding)
-
Final Denial Rate – Represents true lost revenue after appeals are exhausted
Denial Rate Formula
Denial Rate = (Denied Claim Dollars ÷ Total Submitted Claim Dollars) × 100
Tracking this metric monthly—by payer and CPT cluster—is critical for identifying emerging payer behavior changes.
2025 Industry Benchmark Data
AR Performance by Practice Size
In 2025, average AR timelines have lengthened slightly due to expanded medical necessity algorithms used by commercial payers.
| Practice Size | Avg. Days in AR | Best-in-Class |
| Solo Provider | 38–45 | <30 |
| Small Group (2–10) | 35–42 | <28 |
| Mid-Sized (11–50) | 32–38 | <25 |
| Large Group (50+) | 30–35 | <22 |
Top-decile practices consistently maintain sub-30-day AR by combining aggressive denial follow-up, point-of-service collections, and automated eligibility validation.
Denial Exposure by Specialty
AI-driven payer reviews have pushed denial exposure well above historical norms.
| Specialty | Avg. Denial Rate | Target |
| Primary Care | 6–9% | <4% |
| Surgical Specialties | 9–12% | <7% |
| High-Volume / Low-Cost | 4–7% | <3% |
Payer-Specific Trends in 2025
-
Medicare / Medicaid: Lower denial frequency (3–5%) but strict documentation compliance.
-
Commercial Payers: UnitedHealthcare, Aetna, and Cigna now lead denial volume.
Two systems driving 2025 trends:
-
UnitedHealth’s nH Predict – AI-based utilization and necessity scoring
-
Cigna’s PXDx platform – Automated prior authorization and claim validation
Standard denial drivers include medical necessity determinations and authorization mismatches, often triggered post-submission.
Benchmarks by Medical Specialty (Explained)
| Specialty | Avg. Days in AR | Avg. Denials |
| Family Practice | 32–38 | 5–8% |
| Dermatology | 28–34 | 4–6% |
| OB-GYN | 35–45 | 7–10% |
| Orthopedics | 40–50 | 8–12% |
| ASC | 30–40 | 5–7% |
| Wound Care | 45–55 | 9–13% |
| Optometry | 25–35 | 3–5% |
Orthopedics and Wound Care show elevated metrics due to procedure-level prior authorization, frequent medical necessity disputes, and delayed documentation validation—pressures intensified by evolving payer gold-carding rules.
How to Evaluate Your Own Performance
Red Flags That Indicate Revenue Leakage
-
>20% of AR older than 60 days
-
Repeated “eligibility” or “duplicate claim” denials
-
Net collection rate below 95%
AR Aging Targets (Best-in-Class)
-
0–30 Days: ≥ 80%
-
60–89 Days: ≤ 12%
-
90+ Days: < 5–8% (Anything higher indicates systemic failure)
Practical Improvement Strategies
Reducing AR Days
-
Collect patient balances at check-in
-
Verify eligibility 48 hours before service
-
Use credit card-on-file for residual balances
-
Conduct weekly 60+ day AR reviews
-
Maintain a payer-specific timely filing matrix
Reducing Denial Exposure
-
Centralize prior authorization ownership
-
Use advanced claim scrubbers (NCCI + LCD checks)
-
Track denial trends by payer and CPT
-
Keep coders current with 2025 CPT and ICD-10 updates
-
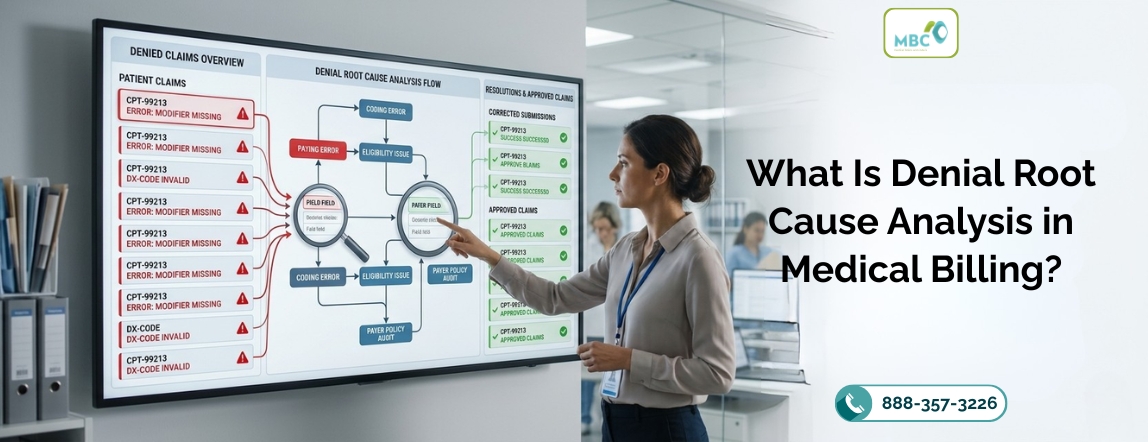
Perform root-cause analysis—not just resubmissions
When Outsourcing Becomes Necessary
Consider professional intervention if:
-
AR exceeds 50 days for 90+ consecutive days
-
Appeals overwhelm internal staff
-
Billing turnover is persistent
-
Denial exposure remains above 10% despite corrective action
Final Takeaway
In 2025, revenue cycle performance is no longer forgiving. Payers are faster, stricter, and algorithmically consistent. Practices must be equally disciplined, data-driven, and proactive.
Ignoring AR aging and denial exposure does not delay the problem—it compounds it.
Is your revenue leaking? Most audits uncover $50,000+ in uncollected revenue within the first 30 minutes. Stop guessing and get your 2025 RCM Audit now.
Professional & Industry Standard Guidance
Note: The following are widely recognized authoritative sources used by practices and organizations to benchmark denial rates and A/R health. They are industry standards referenced in government and compliance discussions.
1. HFMA (Healthcare Financial Management Association) Standardized Denial Metrics
HFMA developed standardized denial metrics and definitions for benchmarking denial rates and AR performance.
Why this matters: HFMA’s frameworks help providers measure Initial Denial Rate, Denial Write-Offs, and Time to Claim Resolution against standardized definitions—key for any healthy AR program.
2. AMA Revenue Cycle Management Guide
The American Medical Association’s RCM guide provides structured KPIs such as denial appeal rates and payer A/R aging reports, which practices can use for internal benchmarking.
Why this matters: While not a government site, the AMA guide is a referenced benchmark in federal and payer compliance dialogues and covers performance metrics in a structured clinical practice context.
Frequently Asked Questions for Healthy AR and Denial Rates
In 2025, anything below 5% is considered good. High-performing practices shoot for 2-3%. If you’re above 10%, you have significant issues with front-end data collection, coding accuracy, or denial management that require immediate attention. Don’t let this slide—every percentage point represents thousands of dollars.
Aim for 30 to 40 days. Staying within this range ensures healthy cash flow and minimizes the risk of claims becoming uncollectible due to timely filing deadlines. Once you’re over 50 days old, you’re almost certainly losing significant revenue due to aging and unaddressed denials.
The 2025 average ranges between 6% and 11%, depending on your specialty and payer mix. But here’s the thing—just because that’s the average doesn’t mean it’s healthy. Leading practices use advanced RCM technology and specialized billing partners to keep their rates well below this average.
Divide your total accounts receivable by your average daily charges. To find average daily charges, divide your total gross charges for the past 12 months by 365. This tells you how many days of revenue are currently tied up in unpaid claims.
Four main culprits: inaccurate patient insurance verification, missing prior authorizations, coding errors (such as incorrect modifiers), and failing to meet payer-specific medical-necessity requirements. In 2025, AI-based auditing by insurance companies is making this worse across the board.
Gross collection rate is the percentage of total charges you collect. Net collection rate is the percentage of allowed charges you collect. Net is the more accurate measure because it accounts for contractual adjustments and write-offs required by your payer agreements. Always track net, not gross.
At least once a week. Monthly reviews are too slow—by then, claims might have already hit the timely filing limits. Weekly analysis lets you spot which payers or CPT codes are causing problems and adjust your strategy in real time.
Studies show that 60% to 90% of denied claims could potentially be recovered through proper appeals. But here’s the kicker: nearly 65% of denials never get appealed because practices don’t have the time or expertise. That’s a massive amount of money just left on the table.

With almost 12 years of experience in healthcare revenue cycle management, this Revenue Cycle Specialist brings deep expertise in medical billing, claims optimization, and practice profitability. Shares industry-backed insights focused on improving collections, reducing denials, and driving operational excellence.