Specialities
 Services
 Resource Center
 Pricing
 About
About
 Contact
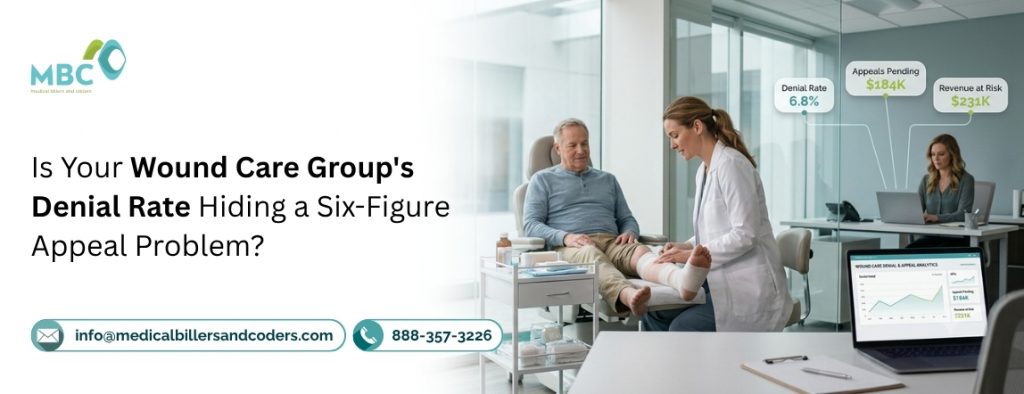
Yes, if your group is only tracking denial rate and not tracking what happens to those claims afterward. A multi-provider wound care group can post a completely normal denial rate and still be sitting on $100K to $250K a year in denied claims that were technically recoverable but never got worked to resolution before the appeal deadline closed. Denial rate measures the front door. It says nothing about what’s happening on the way out.
Why Denial Rate Stops Being Useful at Scale
For a solo practice, denial rate is a rough proxy for billing quality. Fewer denials generally means cleaner claims, and the number is small enough that one person can reasonably keep an eye on every rejected claim. For a multi-provider or multi-location wound care group, that relationship breaks down almost immediately.
Volume goes up. Claims get distributed across more billers, and claim-level visibility into what’s happening at any single site starts to thin out. The meaningful question stops being “how many claims got denied” and becomes “how many of those denials actually got appealed, corrected, and paid before their window closed.” Those are two very different numbers, and only one of them shows up in a standard denial-rate report.
A group running 800 to 1,000 weekly chronic wound visits across multiple sites can post a denial rate that looks identical to a smaller single-location practice, and still be losing five to ten times more revenue in absolute dollars.
The reason is simple: the same percentage applied to a much larger claim volume produces a much larger pool of unworked, expiring appeals. Percentage-based reporting flattens scale out of the picture entirely, which is exactly why it stops being a reliable signal once a group grows past a single site.
Where the Six Figures Actually Hide
- Claims split across billers with no shared deadline visibility. At scale, denials get distributed across a team, and without centralized tracking, no single person sees which claims across the whole group are approaching their appeal deadline. Each biller’s individual denial rate can look fine while the group’s aggregate unworked-denial pool grows undetected in the space between individual worklists.
- Debridement and skin substitute claims requiring per-site documentation. Multi-location groups bill these high-dollar codes (CPT 11042-11047, skin substitute Q-codes) out of several sites, each with its own documentation habits. A depth or medical-necessity gap that’s specific to one location’s charting can repeat across every patient there before anyone notices it’s site-specific rather than random.
- No consolidated view of recoverable dollars, only rate. Practice management reporting typically rolls up denial rate as a single percentage across the whole group. That flattens out exactly the kind of six-figure concentration that would show up immediately if the report tracked dollars sitting in open appeal windows instead of a rejection percentage.
- Skin substitute frequency rules getting missed across a shared EHR template. Multi-site groups frequently run on one shared EHR template across every location. If that template doesn’t force provider-specific application-frequency and site documentation, the same missing modifier or frequency note repeats at every site using it, turning a single template flaw into a group-wide denial pattern instead of an isolated error.
- Payer-mix differences between sites disguising where the real problem sits. A group with locations in different states or different payer networks sees different denial reasons at each site. When leadership reporting aggregates everything into one group-wide denial rate, a severe, concentrated appeal backlog tied to one payer-heavy location gets averaged into the group total and effectively disappears from view.
What This Costs at Group Scale
For a multi-location wound care group generating steady volume across two or more sites, $100K to $250K a year in fully recoverable denied revenue going unworked isn’t an unusual finding. It’s close to the norm when denial management is measured by rate rather than by resolution.
That figure represents claims that were denied for correctable reasons (documentation, coding, medical necessity) and simply never got appealed with corrected support before the payer’s window closed.
The size of the number tends to surprise leadership specifically because nothing in standard reporting points to it. A denial rate sitting comfortably at or below specialty average gives no indication that six figures are quietly expiring in the background, split across sites and billers in amounts too small individually to trigger a second look.
What a Group-Level Fix Actually Looks Like
- A single consolidated denial worklist across every site, ranked by days remaining in the appeal window, not by which biller happens to own the claim and not siloed by location.
- Site-level pattern tracking, so a documentation gap specific to one location, or one shared EHR template, gets caught and corrected there instead of repeating silently across that site’s full patient volume.
- A recovered-dollars metric reported alongside denial rate, so group leadership sees the actual revenue at stake, not just a percentage that looks the same whether the group is losing $20K or $200K.
- Payer-specific denial review, so a backlog concentrated at one payer or one state doesn’t get diluted into an average that hides it from the people who could act on it.
How This Compares to Standard Denial Management
| What’s Tracked | Standard Denial-Rate Reporting | In-House Multi-Site Team | MBC Group-Level Resolution |
| Primary metric | Denial rate (%) | Denial rate (%) + resubmission count | Dollars recovered vs. dollars still in open appeal windows |
| Appeal deadline visibility | None — claims aged the same as new ones | Manual, inconsistent across billers and sites | Consolidated worklist across every site, ranked by days remaining |
| Site-level pattern detection | Not surfaced, rolled into one group average | Depends on whether an individual biller happens to notice | Site-level coding review, tracked separately from the group average |
| Payer-mix blind spots | Averaged out across the whole group | Occasionally flagged, no systematic review | Payer-specific denial review across every location |
| Typical outcome | $100K–$250K/year in denials expire unworked | Some recovery, inconsistent and dependent on staff bandwidth | Recoverable revenue tracked to resolution before deadlines close |
The MBC Approach
At Medical Billers and Coders, our wound care billing services manage denial resolution for multi-provider wound care groups as a single consolidated queue. Every denial is tracked against its specific payer appeal deadline, regardless of which location or provider generated it, and site-level and payer-level coding patterns are reviewed separately so a documentation gap at one location doesn’t get lost in a group-wide average.
Our wound care coding specialists work debridement, skin substitute, and LCD medical necessity documentation to resolution, not just resubmission — backed by denial management services built specifically for multi-site groups — so revenue that’s recoverable actually gets recovered before the window closes.
Request a complimentary group-wide denial audit.
Call 888-357-3226, email info@medicalbillersandcoders.com, or get in touch with us to see how much recoverable revenue is currently sitting in your open appeal windows across every location.
No commitment required — the audit runs against your existing claims data and surfaces the exact dollar figure before any engagement begins. If your group is running multiple sites on a shared EHR template, we’ll also flag whether a single documentation gap is quietly repeating across locations.
FAQs
Denial rate tells you how many claims got rejected. Denial management tells you what happened to them next — whether they were appealed, corrected, and paid before the deadline closed. A group can have strong wound care billing on paper and still be losing six figures if denial management stops at resubmission instead of resolution.
Debridement codes (CPT 11042–11047) and skin substitute Q-codes are the most common denial sources, usually tied to depth documentation gaps or missed application-frequency rules. Because these are high-dollar, high-frequency codes, even a small per-site error compounds fast across a group’s full patient volume.
Not on its own. A denial rate at or below specialty average only measures how many claims were rejected — it says nothing about how many of those denials expired unworked past their appeal window. Groups with average-looking denial rates routinely have $100K–$250K in fully recoverable revenue sitting untracked.
Most multi-site groups run one shared EHR template across every location. If that template doesn’t enforce provider-specific frequency and site documentation, a single missing modifier or note repeats at every site using it — turning one template flaw into a group-wide wound care billing pattern instead of an isolated error.
Ask for dollars sitting in open appeal windows, not just a denial rate percentage — broken out by site, payer, and days remaining before each window closes. That’s the number that shows whether wound care denial management is actually working, and it’s the starting point before any resolution work begins.

A Senior Sales Manager with 18 years of experience in wound care billing services, healthcare sales, and provider relationship management. Passionate about increasing awareness of effective wound care solutions while helping healthcare organizations improve revenue performance, operational efficiency, and patient outcomes.