Specialities
 Services
 Resource Center
 Pricing
 About
About
 Contact
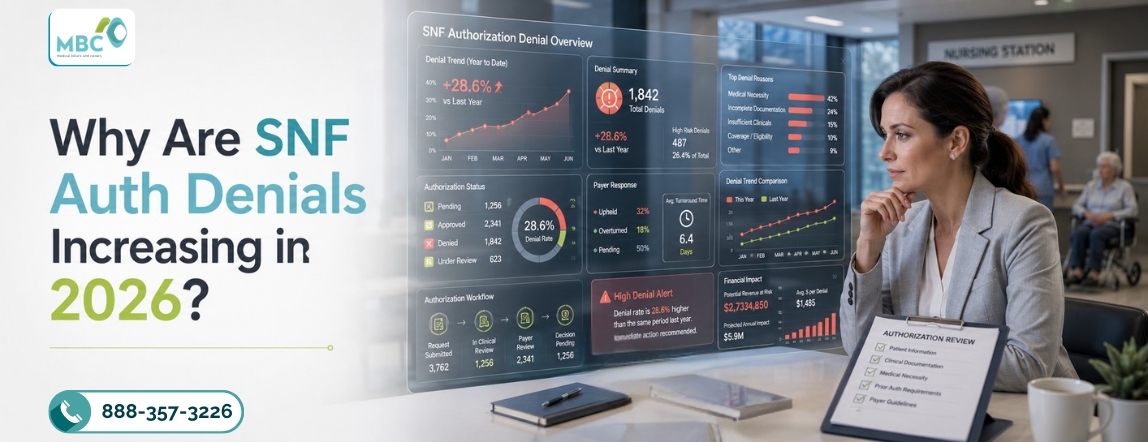
Medicare Advantage denials for skilled nursing facility stays are rising. The main driver: 99% of MA enrollees now sit in plans that require prior authorization for SNF admission. A June 2026 HHS OIG report found that MA organizations denied 12% of those requests overall, and that rate reached 40% for long-stay nursing home residents. Even so, MA organizations overturned 95% of appealed denials. Strong SNF billing services close that gap by defaulting to appeal, tracking continued-stay authorization windows, and packaging payer-specific clinical documentation before the denial happens.
Key Takeaways
- HHS OIG’s June 2026 review of the 19 largest MA organizations found a 12% overall SNF denial rate. Carrier-level rates ranged from 0.4% to 23%.
- Meanwhile, long-stay nursing home residents face a 40% denial rate versus 11% for other Medicare Advantage enrollees.
- Providers appeal only 18% of SNF denials, yet 95% of appeals succeed. That gap means most denials go unchallenged and unrecovered.
- NaviHealth, a UnitedHealth Group subsidiary, processes half of all SNF authorization requests and denies 14% of them. Appeals overturn 97% of those denials.
- In short, a Revenue Integrity Framework converts this pattern into recoverable revenue through payer-specific documentation, continued-stay tracking, and default appeals.
The Benchmark Every SNF Operator Should Be Measuring Against
Before looking at why denials are rising, run this self-check: does your facility know its own MA denial rate by payer, or only its blended average? Most SNFs we onboard can state total denials for the month. Yet almost none can say, without pulling a report, what UnitedHealth denies versus what Humana denies for the same clinical presentation. In fact, that gap in visibility is the real story behind the OIG numbers.
HHS OIG’s June 2026 report reviewed roughly 109,400 SNF admission requests across the 19 largest MA organizations. It found a 12% overall denial rate, with individual carrier rates ranging from 0.4% to 23%. In short, that spread alone tells you denial exposure is not a national constant: it is a function of which payers make up your facility’s census.
The number that should change how every administrator thinks about denials is the overturn rate. Enrollees and providers appealed only 18% of SNF denials, yet 95% of those appeals succeeded. OIG’s own language was blunt: the very high overturn rate “raises concerns about denials that were not appealed.” In other words, the 82% of denials nobody challenged were very likely just as winnable.
Long-stay nursing home residents carry a far worse benchmark. OIG found a 40% denial rate for this population, against 11% for all other MA enrollees. Why the gap? Payers review ongoing skilled-need documentation more closely the longer a resident stays. As a result, a facility with a heavy long-stay census can see this one difference dwarf the blended 12% figure most administrators quote when asked about denial exposure.
Why the Gap Between Denial and Recovery Keeps Widening
Three conditions combine to make this gap structural, not incidental.
First, capitated MA plans carry a financial incentive to approve a lower level of care, such as home health or outpatient therapy, instead of a covered SNF stay. In fact, OIG flagged that for-profit plans denied SNF access at higher rates than nonprofit plans, matching that incentive in practice.
Second, authorization criteria are fragmented across carriers, with no shared standard. Under CMS’s National Coverage Determination framework, Medicare Part A skilled nursing coverage requires daily skilled care tied to a hospital stay of at least three days. However, individual MA plans layer their own clinical thresholds on top. For example, in Novitas Solutions’ MAC jurisdiction, LCD-level documentation expectations for skilled therapy services often differ from what a national MA plan’s internal review criteria demand. So a chart that satisfies traditional Medicare can still trigger a denial from an MA reviewer applying a stricter internal bar.
Third, contracted review vendors add another layer. NaviHealth, a UnitedHealth Group subsidiary, processed about half of all SNF authorization requests industry-wide. It denied 14% of them, a higher rate than MA plans reviewing requests internally. Yet appeals overturned 97% of NaviHealth’s denials, a pattern OIG said raises questions about contractor training and oversight.
What a Revenue Integrity Framework Does Differently
Facilities need a Revenue Integrity Partner, not a claims processor. A generic RCM vendor processes the denial only after it lands. Denial management built for SNF operations works differently: it intervenes at three points in the cycle, not just one.
Before submission, MBC packages documentation to the specific MA plan’s stated criteria, not a generic template applied the same way across payers. Aetna’s clinical threshold language and UnitedHealth’s rarely match, so a one-size-fits-all approach fails.
During the stay, MBC tracks continued-stay review dates against each resident’s authorization window, so a missed renewal never terminates coverage mid-stay. This is exactly where some of the largest single-claim losses in SNF RCM services originate. A systematic tracking protocol prevents these retroactive terminations entirely. Yet they remain common, because most billing operations treat continued-stay review as a periodic task rather than a resident-level calendar.
After a denial, appeal is the default action, not the exception. With 95% of appealed SNF claim denials overturned, treating every denial as a write-off is the single most expensive habit a facility can carry. Denial root-cause engineering closes this gap. It means tracking denial reasons by payer, diagnosis, and MA plan, rather than by claim alone. As a result, a billing team can anticipate which payers apply stricter thresholds and adjust documentation before the next submission, not after the next rejection. That level of expertise is one that generalist medical billing services rarely reach at scale.
Two Tables Below the Fold
OIG June 2026 Findings at a Glance
| Metric | Finding |
|---|---|
| Overall MA SNF denial rate | 12% (range: 0.4%–23% by carrier) |
| Denial rate, long-stay nursing home residents | 40% vs. 11% for other enrollees |
| Share of SNF denials appealed | 18% |
| Appeal overturn rate | 95% overall; 99.7% for UnitedHealth specifically |
| NaviHealth SNF denial rate (processes ~50% of requests) | 14%, with 97% overturned on appeal |
Generic RCM Vendor vs. MBC’s Revenue Integrity Framework
| Revenue Challenge | Generic RCM Vendor | Internal Billing Team | MBC Revenue Integrity Framework |
|---|---|---|---|
| Authorization documentation | Standard template across all payers | Built ad hoc per case | Payer-specific clinical packaging by MA carrier |
| Continued-stay tracking | Manual, reactive to termination notices | Tracked in spreadsheets, inconsistently | Systematic renewal-date tracking per resident |
| Appeal strategy | Filed case-by-case, if at all | Filed only on high-dollar claims | Default appeal on denial, given 95% overturn odds |
| Denial pattern visibility | Claim-level only | Monthly totals, no payer breakdown | Denial root-cause engineering by payer and diagnosis |
| Reporting | Monthly claim status | Internal spreadsheets | CFO-grade dashboard on denial trend and recovery |
Key Takeaways
- MA SNF denial rates vary from 0.4% to 23% by carrier, so blended facility-wide denial metrics hide the payers actually driving the exposure.
- Put simply, the 95% appeal overturn rate means most SNF denials are clinically winnable; the shortfall is in appeal execution, not medical necessity.
- Meanwhile, long-stay nursing home residents face denial rates more than triple the average, making continued-stay documentation a distinct priority, not an afterthought.
- Ultimately, facilities without payer-specific pre-authorization protocols and default-appeal workflows are absorbing recoverable revenue as write-offs.
MBC Spotlight
MBC’s Skilled Nursing Facility Center of Excellence pairs PDPM-certified coding with payer-specific authorization protocols, backed by a 97% clean claim rate and 98% client retention across our SNF portfolio. Facilities that onboard our Revenue Integrity Framework cut Days in AR by 30% within 90 days. Continued-stay tracking, default-appeal workflows, and old AR recovery close the gap between denial and recovery.
MBC’s fee structure follows facility census and payer mix through a custom quote, never a published flat rate.
Request Your Revenue Diagnostic to see where your facility’s MA denial management and appeal pattern stands against the OIG benchmarks above.
Source: U.S. Department of Health and Human Services, Office of Inspector General (June 2026)
FAQs
Prior authorization is now required by nearly all MA plans for SNF admissions, and HHS OIG’s June 2026 report found a 12% overall denial rate with wide variation by carrier, driven in part by capitated incentives to approve a lower level of care instead of a covered SNF stay.
HHS OIG found that MA organizations overturned 95% of appealed SNF denials in the enrollee’s favor, and UnitedHealth alone overturned 99.7% of its own denials on appeal. Only 18% of denials were appealed at all, meaning the vast majority of denied SNF claims were never challenged and likely never recovered as revenue.
Pull your denial log by payer, not just by total, and check what share of denials were appealed versus written off. If your appeal rate sits well under the industry’s 18% baseline, you are very likely leaving winnable revenue unclaimed given the 95% overturn rate.
OIG data shows a 40% denial rate for long-stay residents compared with 11% for other enrollees, reflecting stricter MA scrutiny of ongoing skilled-need documentation the longer a resident’s stay continues. Facilities with a high proportion of long-stay residents should treat continued-stay documentation as a distinct workflow rather than an extension of admission paperwork.
It replaces reactive claim correction with payer-specific pre-admission documentation, systematic continued-stay tracking, and default appeals on every denial, converting a category OIG shows is 95% winnable into recovered revenue instead of write-offs. Denial root-cause tracking by payer also lets a billing team adjust documentation ahead of the next submission rather than after another rejection.

A Subject Matter Expert in healthcare billing operations with nearly 10 years of experience, sharing insights on claims processing, coding support, and revenue cycle optimization. Dedicated to educating healthcare professionals on compliance, accuracy, and strategies to improve billing performance.